

Community post
BITCOIN: Getting Really Squeezy
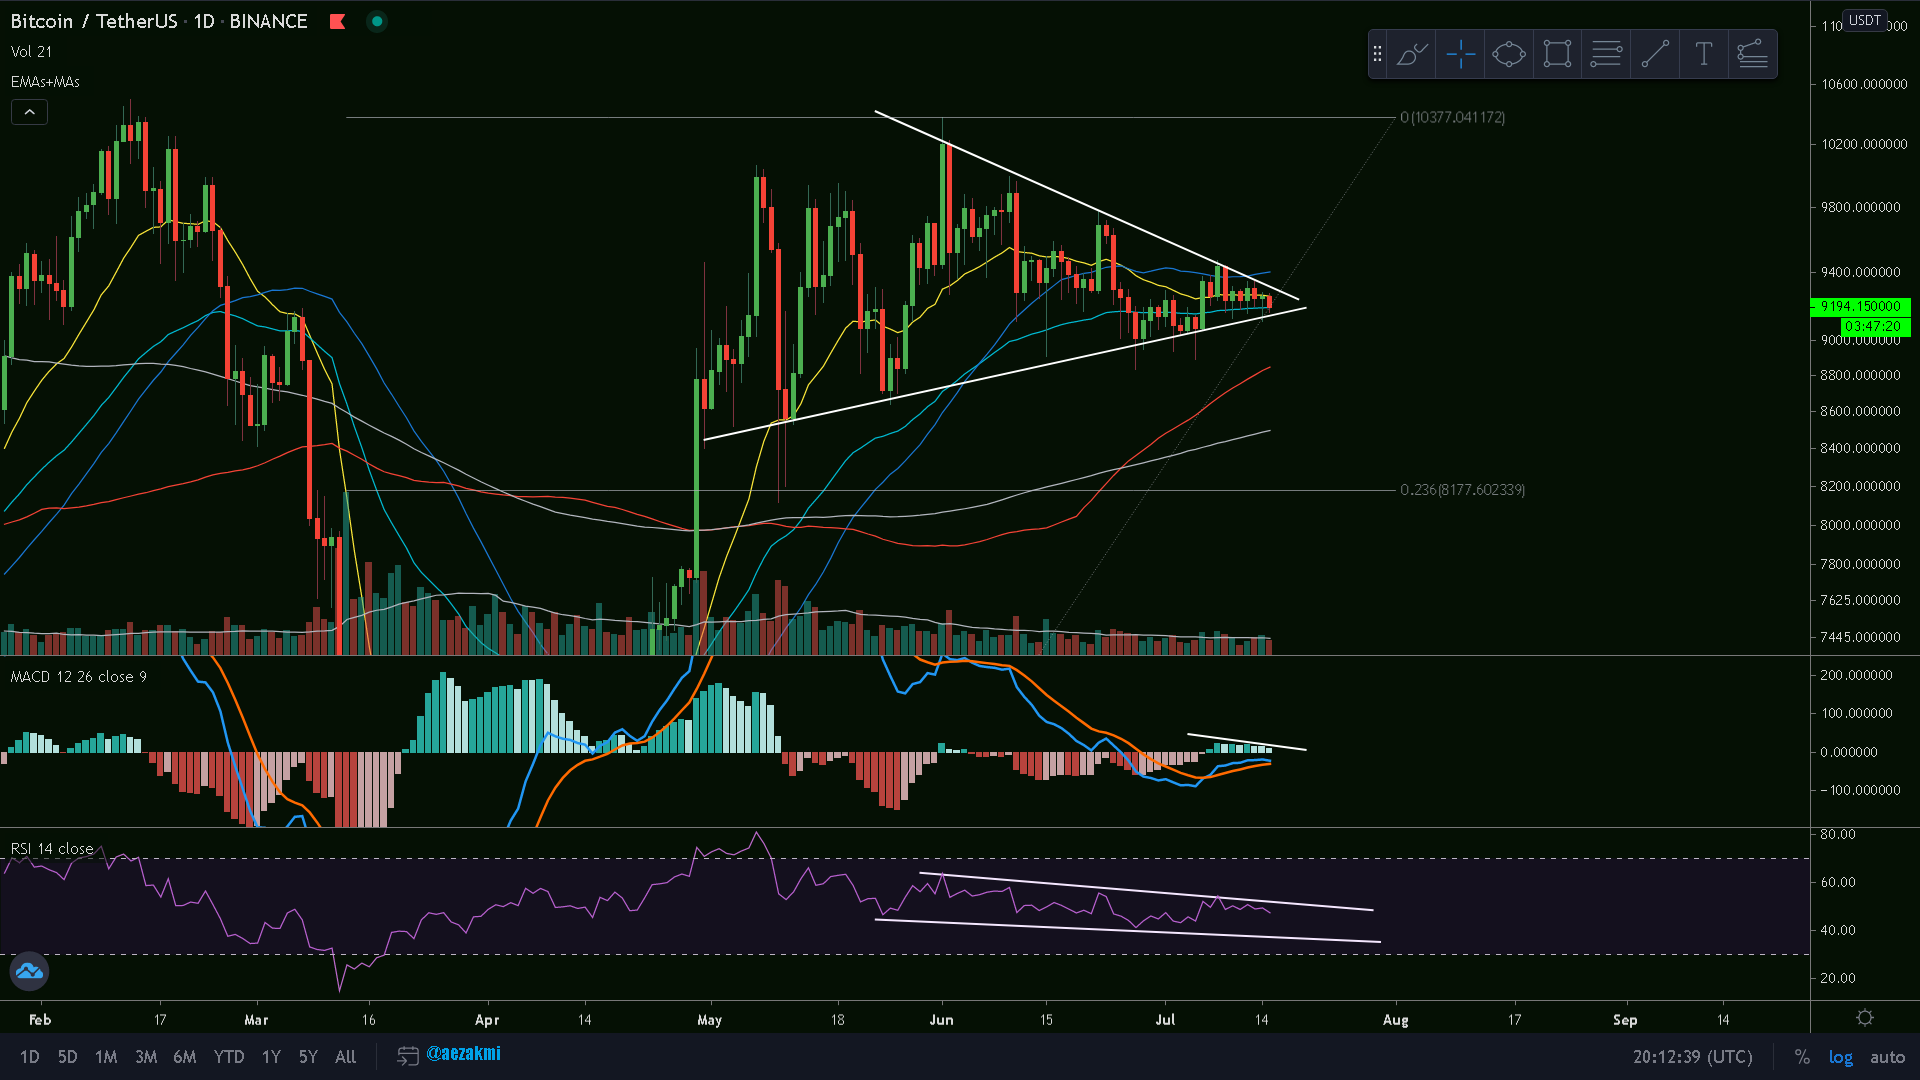
BTC/USD Daily Chart
In my previous post I mentioned that Bitcoin is about to move; well, the market seems quite undecided and there seems to be some sort of a balance between the bulls and the bears. We are now almost at the very top of the triangle, testing the 55 day EMA (blue). The RSI is continuing it's downtrend in the descending channel and the MACD-Histogram is decreasing, indicating a weakening momentum.
[Ctrl + Click here to enlarge the image in a new tab (steemitimages)](https://steemitimages.com/0x0/https://files.peakd.com/file/peakd-hive/aezakmi/3V7UX7Yy-bbtc.png)
The 55 day EMA support is reinforced by the basis (middle) line of the Bollinger Bands. The pinching BBands are usually indicating an upcoming movement. The OBV is still in the flat channel, not acting as a leading indicator this time, but the Stochastic RSI indicates a rejection and a further downtrend.
So, where are we going?
[Ctrl + Click here to enlarge the image in a new tab (steemitimages)](https://steemitimages.com/0x0/https://files.peakd.com/file/peakd-hive/aezakmi/JMZ5DlD5-bbtc2.png)

Replies (0)
Conversation
No replies yet
Replies will appear here as people join the conversation.