
.png)
Community post
Bitcoin Analysis for 02/04/2021

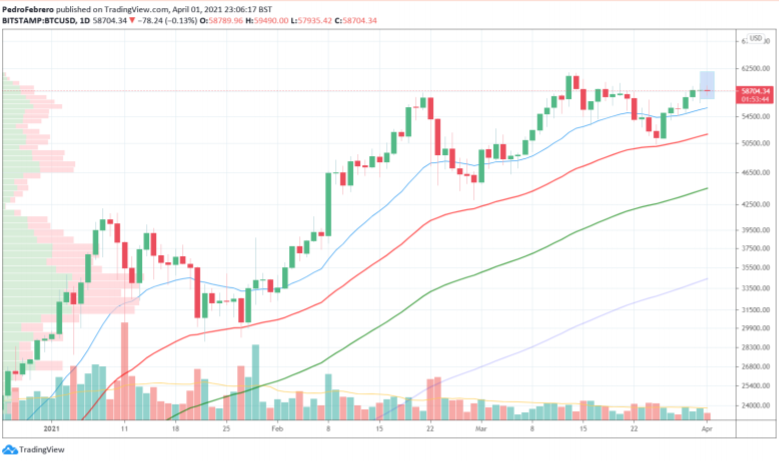
In the past 24 hours, bitcoin's price has stalled, consolidating above $58,500 just like yesterday.
BTC/USD has risen significantly during the past seven days, climbing more than 11%, and it is currently attempting to break a critical resistance level of 58,800 according to CoinGecko.
We think that at any moment, there could be a sudden swing that takes bitcoin past its prior record price.
Hence, while we think there's a slight chance bitcoin's price will move above 60,000 for a few more days while it gathers enough momentum to rise above its prior all-time high.
We hope buying volume returns soon; otherwise, we'll be forced to update our current view.
Oppositely, a meaningful bullish sign is a fact that bitcoin's price has been holding well above both the 21-day Modified Moving Average (MMA) near 55,500.
In terms of news, according to the Finance Magnates' Bilal Jafar,
"Goldman Sachs, one of the leading investment banks in the world, announced today that the bank is planning to offer cryptocurrency investment services in the second quarter of 2021."
This is yet another reason to pump more fuel into the fire: institutional adoption.
According to the financial institution, Goldman currently holds over $1.8 trillion AUM, which proves just how critical this move could be for bitcoin's price.
To conclude, we believe bitcoin's price will soon reach a fresh, all-time high, and we remain bullish on BTC/USD as long as:
- BTC/USD remains above its 20-day MMA (red), 50-day MMA (green), and 200-day MMA (blue).
- BTC/USD doesn't drop below $55,000.
- BTC/USD daily volume goes above its 21-day MMA soon.
Traders Thoughts
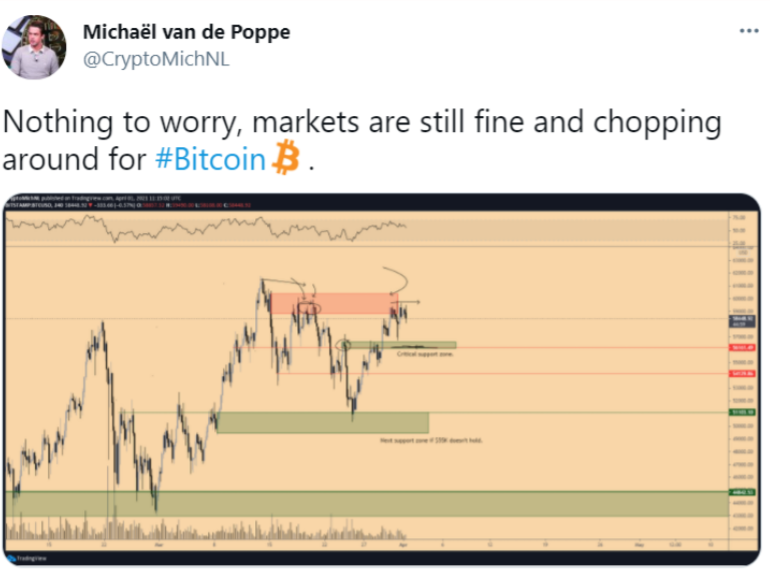
Today’s first tweet comes from Michael van de Poppe, whose Twitter handle describes him as both a technical analyst and a full-time trader at the Amsterdam Stock Exchange.
In his post, Poppe shared a four-hour chart of bitcoin’s price and added a few trend lines showing support and the Moving Average Convergence Divergence (MACD) at the top.
According to Investopedia, the MACD indicator
“triggers technical signals when it crosses above (to buy) or below (to sell) its signal line.”
What the data present in the chart shows is:
- The MACD was entering the overbought above 75 but has now cooled off.
- The first critical support zone (red) is at $56,161.
- The second critical support zone (red) is at $54,129.
- The third support zone below 51,103.
- The fourth and last support zone at $44,482.
It seems the analyst thinks there’s a chance bitcoin’s price still drops towards the first two support zones. Poppe also wrote that
“Nothing to worry, markets are still fine and chopping around for #Bitcoin.”
Hence, we think that if bitcoin’s price does not hold above 57,000.
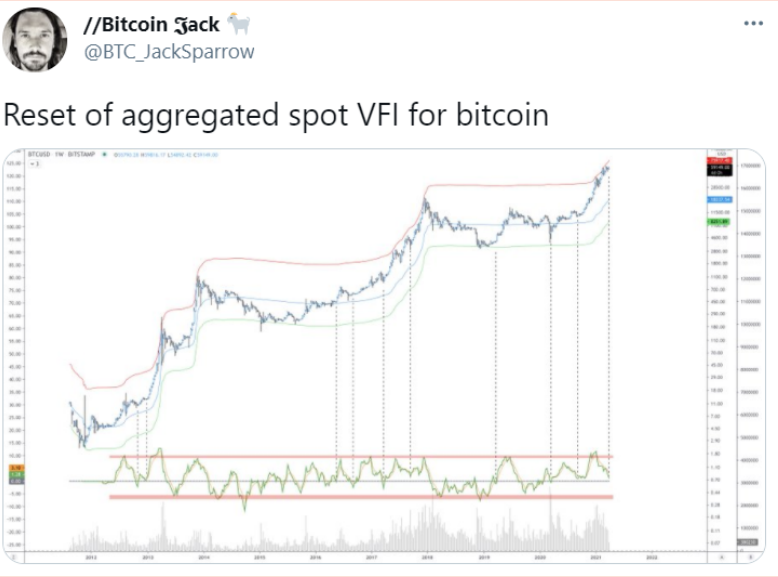
The following post comes from Bitcoin Jack, a trader and market analyst.
In the Twitter post, Bitcoin Jack shared a weekly bitcoin’s price chart and wrote that
“Reset of aggregated spot VFI for bitcoin.”
According to Investopedia, the Volume Force Indicator (VFI) is
“is a technical indicator that measures the amount of power used to move the price of an asset.”
Essentially, this indicator points to the fact there’s plenty of room for bitcoin’s price to grow.
Bitcoin Jack identified the moments when the VFI reversed its downtrend, and it seems to match extreme price fluctuations.
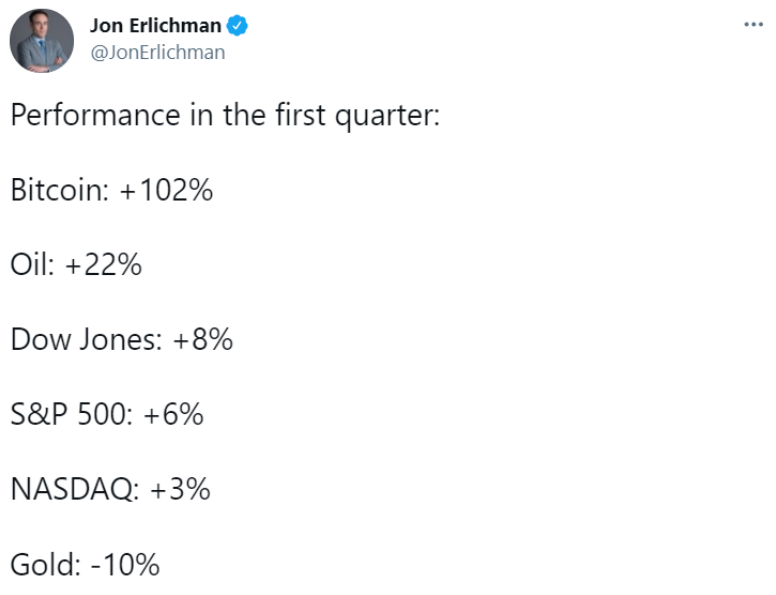
The following tweet comes from Jon Erlichman, a reporter on Bloomberg with over 175,000 followers on Twitter.
In his post, Erlichman compared the performance of bitcoin to oil, the Dow Jones, the S&P 500, the NASDAQ and gold, during the initial quarter of 2021.
Astonishingly, bitcoin grew at least five times larger than its second contender, oil, over 102%.
The data indicates a significant overperformance of bitcoin vs other assets, another pointer that bitcoin is enjoying a sudden flock of new buyers.
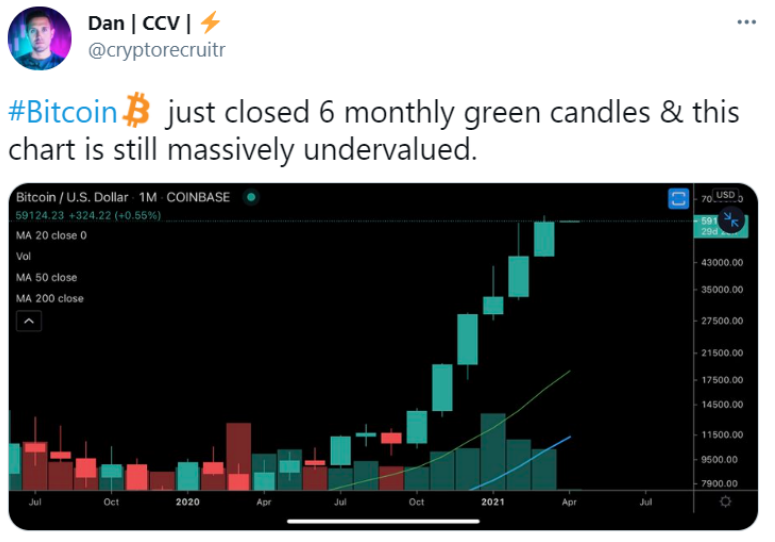
The last post of the week comes from Dan, whose Twitter describes him as Crypto Capital Venture and BlockGains.
In its post, Dan shared the monthly bitcoin’s price chart and wrote that
“#Bitcoin just closed 6 monthly green candles & this chart is still massively undervalued.”
While we agree there’s room for more growth, as long as buyers keep entering the space, we also notice two bearish signs. The first is that bitcoin’s monthly price chart shows no red candles for half a year, which indicates that sooner or later there will be a significant correction; the other indicator is the decreasing volume, which points to less money coming into bitcoin each consequent month.
Hence, we think that there’s a chance for a drop, perhaps after bitcoin reaches a brand new all-time high.
Nevertheless, we’re opposed to counter-trading or trading against the trend; therefore, we believe the short-term probabilities point to a new price increase and not the opposite.
Price Prediction
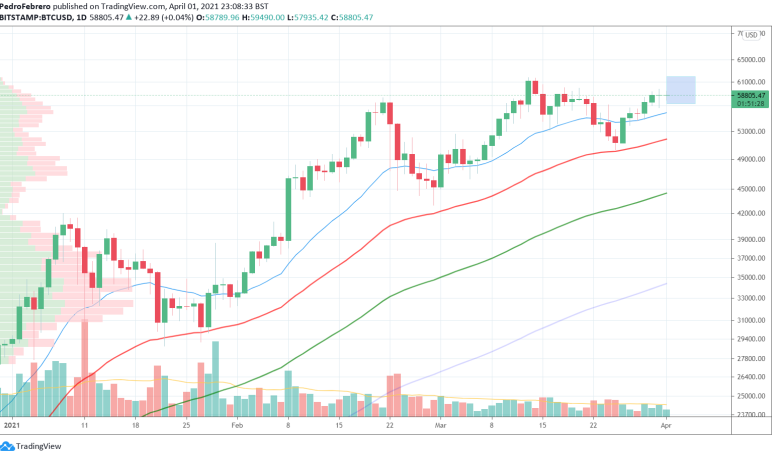
At the time of this writing, bitcoin is trading close to $58,800 according to CoinGecko. In the past seven days, BTC/USD has been on an uptrend, growing north of 11%, and we think that may continue during the following weeks. We hope to witness a brand new record price soon, perhaps by the end of the weekend.
As we wrote in the introduction, we remain incredibly bullish on bitcoin's short-term price if the cryptocurrency holds above $55,000, a critical resistance level that has turned into support.
Adding to that, most analysts are pretty bullish on bitcoin due to a significant number of indicators pointing to a sudden upswing once buyers return in full force.
Therefore, how do we think the price will trade today and during the weekend? As shown in the above chart, we believe that bitcoin could approach $62,000 in the next few days, as long as buyers return to the bitcoin space. There's a chance bitcoin breaks this level until Sunday, but buying volume would need to grow for this to happen massively.
On the other hand, we don't expect the cryptocurrency to drop much below 55,000 could play out; however, this is highly unlikely.
To finalize, the VPVR shows a high number of buy orders between 50,000. It also indicates that there are almost no sellers left above $62,000.
Posted Using LeoFinance Beta
Replies (1)
https://twitter.com/Alberto35623593/status/1377763584684474370