

Community post
How to Create responsive and customizable charts using Chartist.JS
What Will I Learn?
- You will learn about Chartist.JS Charting library
- You will learn how to integrate charts in your website
- You will learn how to customize and animate charts
Requirements
- You must have basic HTML and CSS knowledge
- You must have basic JavaScript knowledge
- You need a Text Editor, Web browser and internet connection to download resources if any.
Difficulty
- Intermediate
Tutorial Contents
Introduction
Chartist.JS is an open source Charting JavaScript library built with SVG. Chartist was built by Gionkunz to provide a solution to the problems faced by charting libraries. It’s lightweight, simple and flexible to integrate into a website. Chartist provides designers and developers the opportunity to create charts that do not depend on other libraries and works perfectly across browsers.
Chartist uses inline-SVG to draw simple, fully responsive and customizable charts in the DOM by using CSS to style the charts and JavaScript to handle the configuration of the charts. Some of the advantages of using Chartist.JS over other charting libraries are; charts can be configured to be responsive using CSS3 media queries and it puts more emphasis on convention rather than configuration.
For this tutorials, we are going to create a simple web page to demonstrate how to setup and integrate Chartist.JS charts into our websites. We will use HTML5, CSS3 and some JavaScript codes for the setup.
STEPS
Setup web page
To setup our web page we need to follow the following steps;
- Open your text editor and create a file and save and save it as “chartist.html” in your development folder.
- Write the standard HTML5 elements we use in defining a HTML file inside our “chartist.html”. Something like this;
<!DOCTYPE html>
<html>
  <head>
    <title>Utopian-io - Responsive and customizable charts using Chartist.JS</title>
  </head>
  <body>

  </body>
</html>
Integrating Chartist.JS
To integrate Chartist.JS into our webpage we’ll need to get the library and we have two options on how to go about it. One of the option is to download the library from the official repository here https://github.com/gionkunz/chartist-js/ or we can use the available CDN links. In this tutorial we’re using the CDN links but it’s recommended to download and integrate it locally for production purpose.
The necessary CSS and JS CDN links are;
CSS
<link rel="stylesheet" href="http://cdn.jsdelivr.net/chartist.js/latest/chartist.min.css">
JS
<script src="http://cdn.jsdelivr.net/chartist.js/latest/chartist.min.js"></script>
NB: The additional files linked are that of bootstrap which we’ll use to setup our web page. Our work does depend on it. If you’re still interested you can get it here.
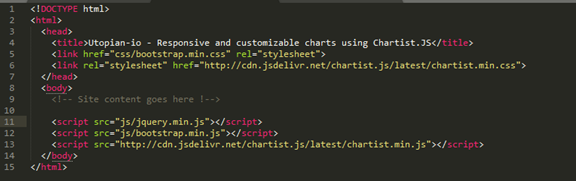
All the required files are linked. Let’s begin;
Steps:
- Find the
<body>section in “chartist.html” and create two div’s with a class.
<div class="ct-chart-line ct-perfect-fourth"></div>
<div class="ct-chart-bar ct-perfect-fourth"></div>
- Go to the bottom of the file and write the following JavaScript codes within
<script type="text/javascript"> </script>to initialize our charts.
For the line chart, that’s our first div. These are the codes that will produce a line chart with three data series.
// Our labels and three data series
	var data = {
	  labels: ['Week1', 'Week2', 'Week3', 'Week4', 'Week5', 'Week6'], // lables of the chart
	  series: [ // the data series in other words the lines
	    [50, 41, 103, 170, 151, 250], //first data series
	    [93, 29, 91, 15, 14, 6], //second data series
	    [2, 1, 9, 4, 2, 10] //third data series
	  ]
	};
	// We are setting a few options for our chart and override the defaults
	var options = {
	  // It will not draw the line chart points
	  showPoint: false,
	  // Disables line smoothing
	  lineSmooth: false,
	  // X-Axis specific configuration
	  axisX: {
	    // We can disable the grid for this axis
	    showGrid: false,
	    // and also don't show the label
	    showLabel: false
	  },
	  // Y-Axis specific configuration
	  axisY: {
	    // Lets offset the chart a bit from the labels
	    offset: 60,
	    // The label interpolation function enables us to modify our values
	    // used for the labels on each axis.
	    labelInterpolationFnc: function(value) {
	      return '$' + value;
	    }
	  }
	};
	// We Pass our configuration as third parameter to the chart function for it work
	new Chartist.Line('.ct-chart-line', data, options);
Bar Chart
new Chartist.Bar('.ct-chart-bar', {
	  labels: ['Mon', 'Tue', 'Wed', 'Thu', 'Fri', 'Sat', 'Sun'],
	  series: [
	    [5, 4, 3, 7, 5, 10, 3]
	  ]
	}, {
	  axisX: {
	    // On the x-axis start means top and end means bottom
	    position: 'start'
	  },
	  axisY: {
	    // On the y-axis start means left and end means right
	    position: 'end'
	  }
	});
Code Explanation
First of all, we set up our chart data via var data = { labels: ['week1', ...], series: [50, …] } and use var options = { } for settings. There are various options you can use for your charts, here. Next, is to pass the configuration to our chart function as the last line in our scripts. Description in form of comments provided in the codes for better understanding.
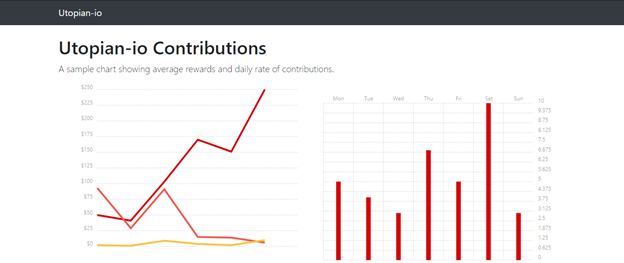
Source Code
<!DOCTYPE html>
<html>
  <head>
    <title>Utopian-io - Responsive and customizable charts using Chartist.JS</title>
    <link rel="stylesheet" href="chartist.min.css">
    <link href="css/bootstrap.min.css" rel="stylesheet">
  </head>
  <body style="padding-top: 5rem;">
    <nav class="navbar navbar-expand-md navbar-dark bg-dark fixed-top">
    <div class="container">
      <a class="navbar-brand" href="#">Utopian-io</a>
      <button class="navbar-toggler" type="button" data-toggle="collapse" data-target="#navbarsExampleDefault" aria-controls="navbarsExampleDefault" aria-expanded="false" aria-label="Toggle navigation">
        <span class="navbar-toggler-icon"></span>
      </button>
    </div>
  </nav>
  <main role="main" class="container">
    <h1>Utopian-io Contributions</h1>
    <p class="lead">A sample chart showing average rewards and daily rate of contributions.</p>
      <div class="container welcome-div">
        <div class="row">
        	<div class="col-md-6">
        		<div class="ct-chart-line ct-perfect-fourth"></div>
        	</div>
        	<div class="col-md-6">
        		<div class="ct-chart-bar ct-perfect-fourth"></div>
        	</div>
        </div>
    </div>
  </main>
    <script src="js/jquery.min.js"></script>
    <script src="js/bootstrap.min.js"></script>
    <script src="chartist.min.js"></script>
    <script type="text/javascript">
	// Our labels and three data series
	var data = {
	  labels: ['Week1', 'Week2', 'Week3', 'Week4', 'Week5', 'Week6'], // lables of the chart
	  series: [ // the data series in other words the lines
	    [50, 41, 103, 170, 151, 250], //first data series
	    [93, 29, 91, 15, 14, 6], //second data series
	    [2, 1, 9, 4, 2, 10] //third data series
	  ]
	};
	// We are setting a few options for our chart and override the defaults
	var options = {
	  // It will not draw the line chart points
	  showPoint: false,
	  // Disables line smoothing
	  lineSmooth: false,
	  // X-Axis specific configuration
	  axisX: {
	    // We can disable the grid for this axis
	    showGrid: false,
	    // and also don't show the label
	    showLabel: false
	  },
	  // Y-Axis specific configuration
	  axisY: {
	    // Lets offset the chart a bit from the labels
	    offset: 60,
	    // The label interpolation function enables us to modify our values
	    // used for the labels on each axis.
	    labelInterpolationFnc: function(value) {
	      return '$' + value;
	    }
	  }
	};
	// We Pass our configuration as third parameter to the chart function for it work
	new Chartist.Line('.ct-chart-line', data, options);

	new Chartist.Bar('.ct-chart-bar', {
	  labels: ['Mon', 'Tue', 'Wed', 'Thu', 'Fri', 'Sat', 'Sun'],
	  series: [
	    [5, 4, 3, 7, 5, 10, 3]
	  ]
	}, {
	  axisX: {
	    // On the x-axis start means top and end means bottom
	    position: 'start'
	  },
	  axisY: {
	    // On the y-axis start means left and end means right
	    position: 'end'
	  }
	});
    </script>
  </body>
</html>
Curriculum
Some of my previous works are;
- How to Create a Spreadsheet component using HTML5 and JavaScript
- How to introduce new feature to users of your application using Bootstrap Tour
- How to Create a quick and beautiful landing page using Bootstrap-4
Posted on Utopian.io - Rewarding Open Source Contributors
Replies (12)
Wow, computer lord😂...really enlightening👌
While am not very conversant with HTML and CSS, this surely looks useful and quite easy to implement. Thanks.
HTML and CSS isn’t that difficult to grab especially when you can handle Java :) I checked you out. You also contribute quite often in Java. That’s great!
I’ll follow you and try to see if I can catch one or two things.
hehe. Not a computer lord o. Thanks for stopping by.
Lol..... Yeah i contribute quite often on Java. Basically i just post on my knowledge as a beginner in programming.
Thanks for taking us through this tutorial
Thank you for the contribution. It has been approved.
You can contact us on Discord.
[utopian-moderator]
Thank you!
Definitely a bug.
You've got upvoted by
Utopian-1UP!You can give up to ten 1UP's to Utopian posts every day after they are accepted by a Utopian moderator and before they are upvoted by the official @utopian-io account. Install the @steem-plus browser extension to use 1UP. By following the 1UP-trail using SteemAuto you support great Utopian authors and earn high curation rewards at the same time.
1UP is neither organized nor endorsed by Utopian.io!
Not this one.
Hey @aliyu-s I am @utopian-io. I have just upvoted you!
Achievements
Community-Driven Witness!
I am the first and only Steem Community-Driven Witness. Participate on Discord. Lets GROW TOGETHER!
Up-vote this comment to grow my power and help Open Source contributions like this one. Want to chat? Join me on Discord https://discord.gg/Pc8HG9x