

Community post
Bitcoin Hourly Chart - RSI
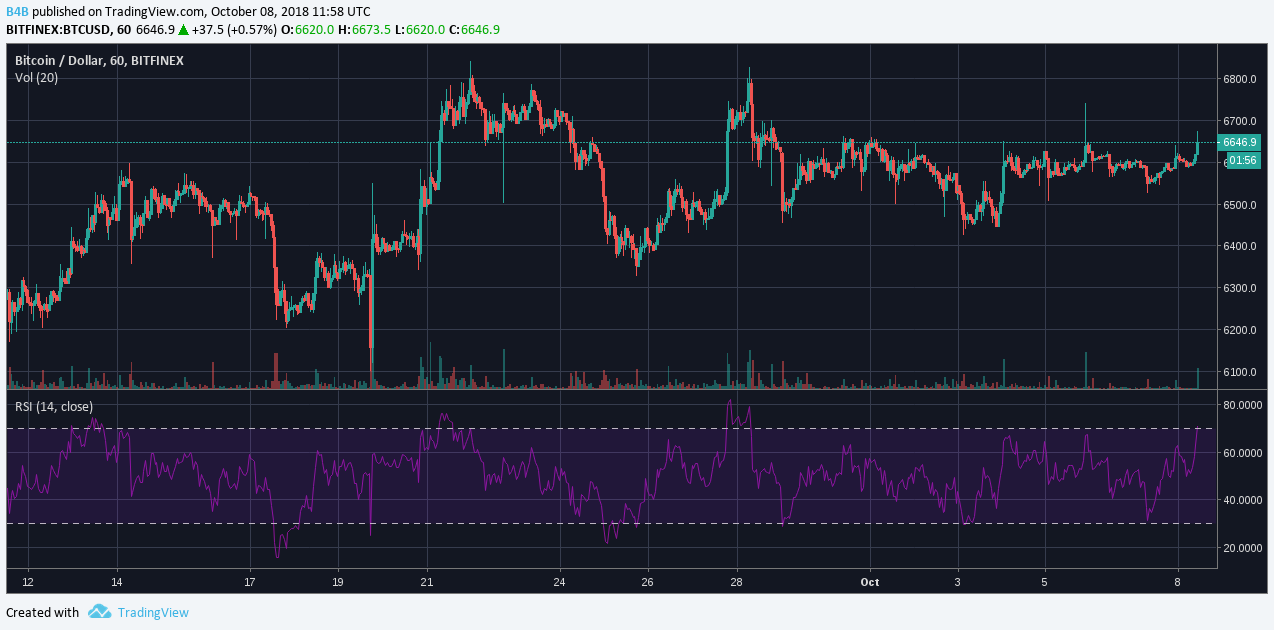
RSI on the hourly chart is just above 70, which means it is entering overbought territory. Spikes above 80 however are not unusual with Bitcoin.
Disclaimer: I am not a financial advisor. The crypto market is very volatile, make your own conclusions and invest at your own risk.
Replies (0)
Conversation
No replies yet
Replies will appear here as people join the conversation.