

Community post
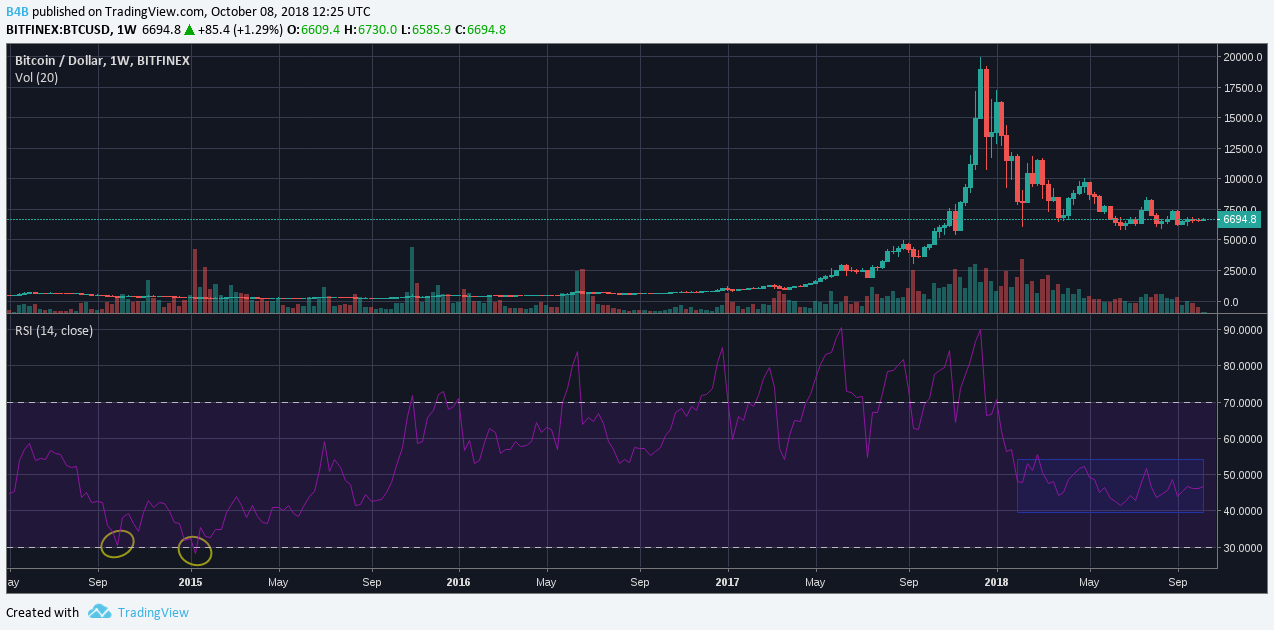
Bitcoin Weekly Chart - RSI
RSI has been between 40-50 on the weekly chart the last couple of months. It never entered oversold territory though. Is this the bottom? No one can tell for sure. The last bear market saw a RSI value under 30 before the market started to turn bullish again.
Disclaimer: I am not a financial advisor. The crypto market is very volatile, make your own conclusions and invest at your own risk.
Replies (0)
Conversation
No replies yet
Replies will appear here as people join the conversation.