

Community post
Steem analysis 24/07/2018
Over the last year, I have been introduced to Elliott Wave Theory and have learned to use it in trading cryptos. More recently, I have looked into the more specific "Fibonacci Pinball" method described by Avi Gilburt's group. I have never subscribed to any of their services, but they have an Education section of their website, which includes an introduction to their Fibonacci Pinball method as well as a more detailed presentation on the topic.
I have decided to practice their method and use this blog to document my analysis for my own purposes.
I am not a financial advisor. Do not consider this to be financial advice. I am posting it here for my own practice and future review only.
Today let’s take a look at STEEM.
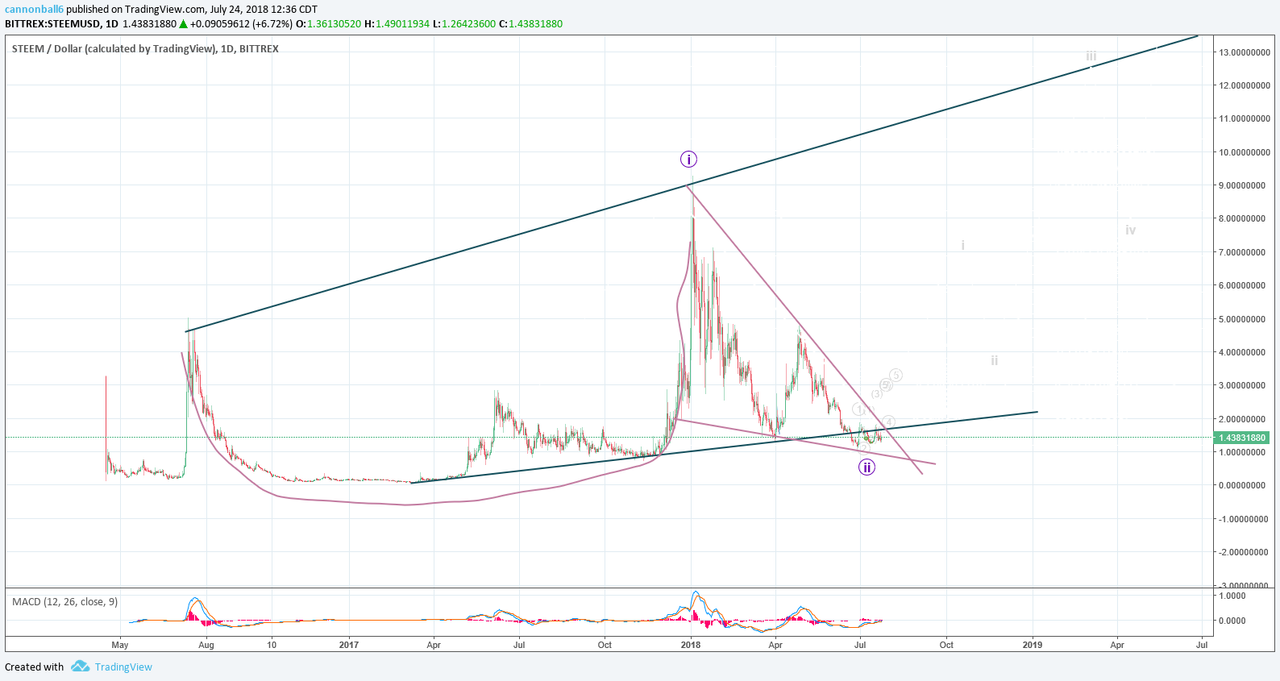
Going back to 2016, STEEM has formed a cup and handle between broadening long term support/resistance lines. It looks like it is in the final stages of completing the handle and has put in a set of minor higher lows, after falling below long term support.
Taking a closer look, as long as STEEM stays above 2.72 for circled wave 5. This pathway suggests STEEM will soon break out of the handle formation to the upside, and back above long term support/resistance.
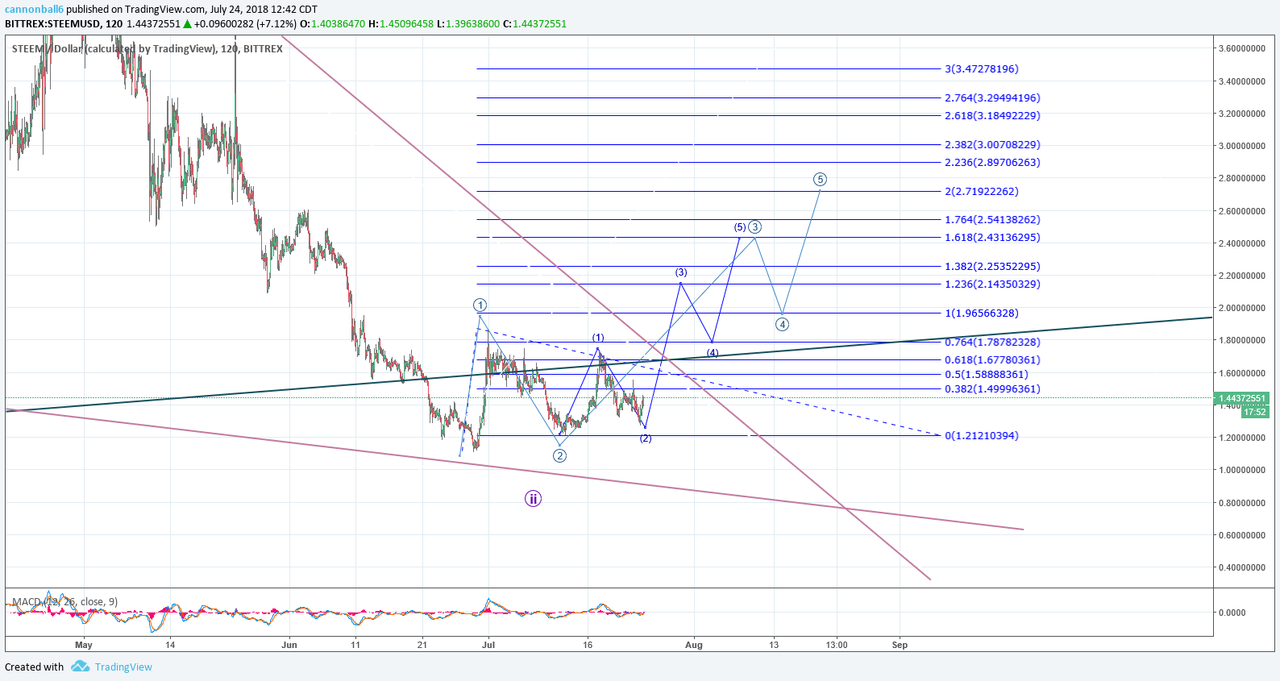
Alternatively, if STEEM breaks 0.80 before breaking out.
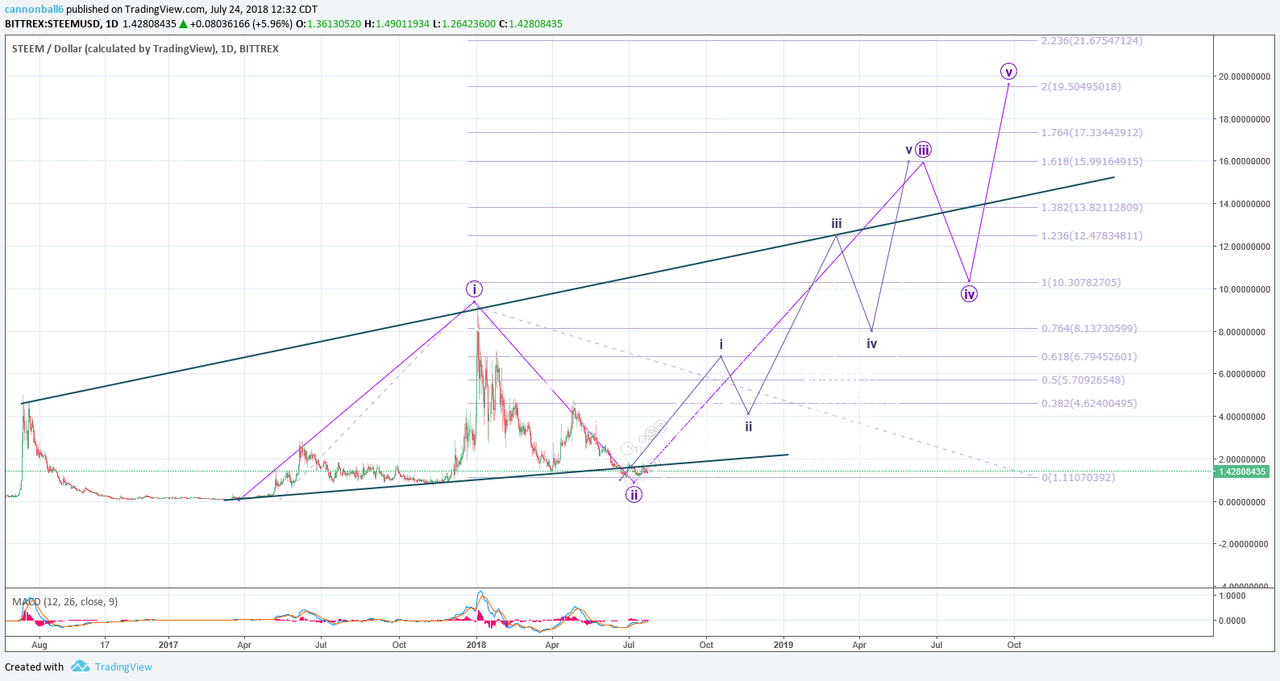
Going back to a longer range view provides a possible path to $20 or so.
If you enjoyed this analysis, please upvote, comment, resteem.
Replies (2)
@cannonball6 maybe something will change
Correct. That is why I called this an early projection of price pathway. It is also why I identified downside support, which if broken would likely lead to further downward price movement.