

Community post
BITCOIN CHART ANALYSE
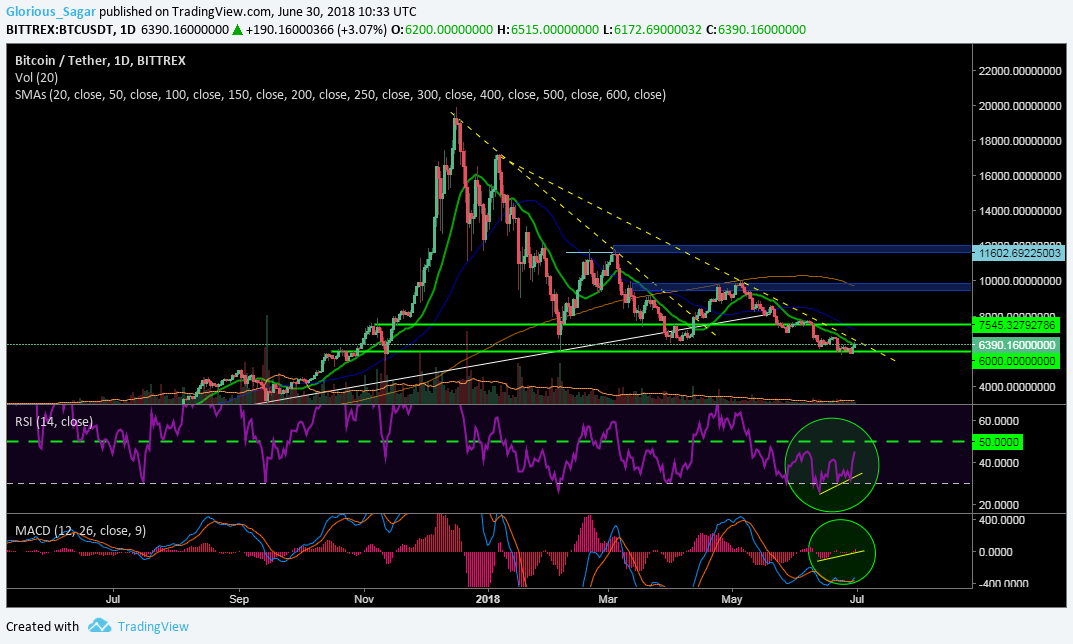
Bitcoin was trading between 5800 for last 5-6 days. But now its trying to go up to break the near resistance trendline. Here I also got a bullish divergence in RSI and MACD, which is really a good sign for Bitcoin. If Bitcoin successfully breaks the resistance line, Then the next stop will be 7200 (Horizontal Line as per previous support-resistance). And if fail to break the resistance or to sustain above the 6000 also. Now bitcoin needs some volume which is being not seen in the chart to break the resistance.
Just wait for breaks the 6800$ level,
You can clearly see all the support and resistance line in the picture and volume too.
Replies (0)
Conversation
No replies yet
Replies will appear here as people join the conversation.