

Community post
Some Cryptocurrencies To Watch Out For This Month.
BTC kicked off the year on a losing red side, dropping about 20%, its worst performance since January 2018. Now all focus is on February which according to data gathered from previous years have always favored the bulls or buyers aside from 2014 and 2020 which had a negative effect on buyers.
The recent down trend in BTC have turned JP Morgan analysts bearish as they agree that increased volatility could hinder further institutional adoption of BTC and crypto in general. To further demonstrate this, in a note the analysts have reduced their long term theoretical BTC price target from 38,000, whoops that is quite a drop there…
If the recovery of BTC extends, some alt coins could attract aggressive bulls. So let's take a look at top 5 charts on my list for this month:
BTC/USDT
As BTC has pulled a strong downtrend, most of the market decision is to sell whenever there is a rally instead of buying the dips. Watch out! The first sign of a change in move will be a break and close above the 20-day exponential moving average, such a trend will signal that demand is beginning to exceed supply. The BTC/USDT pair could then move towards a 50-day simple moving average estimated around 35,507.01. If this support cracks, selling could pick up to the last low of Jan 42 at 30,0000.

ETH/USDT
There is resistance near the breakdown level for ETH at 2,652, however a little bacon of hope is that the bulls haven't yet given up their positions. This suggests that traders are still buying the dip. The bulls would try to push the price above 2,802 at the 20 day exponential moving average (EMA) If they succeed. If this happens, it would be a sign that lots of traders have stopped selling suggesting an upward trend once again. However if the opposite happens and price turns downward instead of its current level, sellers or bears would try to balance ETH/USDT pair 1,700.

SOL/USDT
Bulls or buyers have been trying to push the price of Solana above 80.83 and 104.82, now the bears would try to pull it down below 66.03 if the bulls once again fail to remedy price at the support line. However if price rises a bit above 80.83 and 116

DOGE/USDT
Doge has been trying to break out of it's resistance having been revolving around 0.15 for the past few days. Bulls are nearing support but have not yet had success quite yet. A relative strength index(RSI) indicator analysis shows that a bullish trend is forming suggesting that selling pressure may be reducing. But if the bulls or buyers fails to push price above 0.13 this could result in further selling. Driving prices down to 0.16 in order to ward off short-term sell from bears.

BNB/USDT
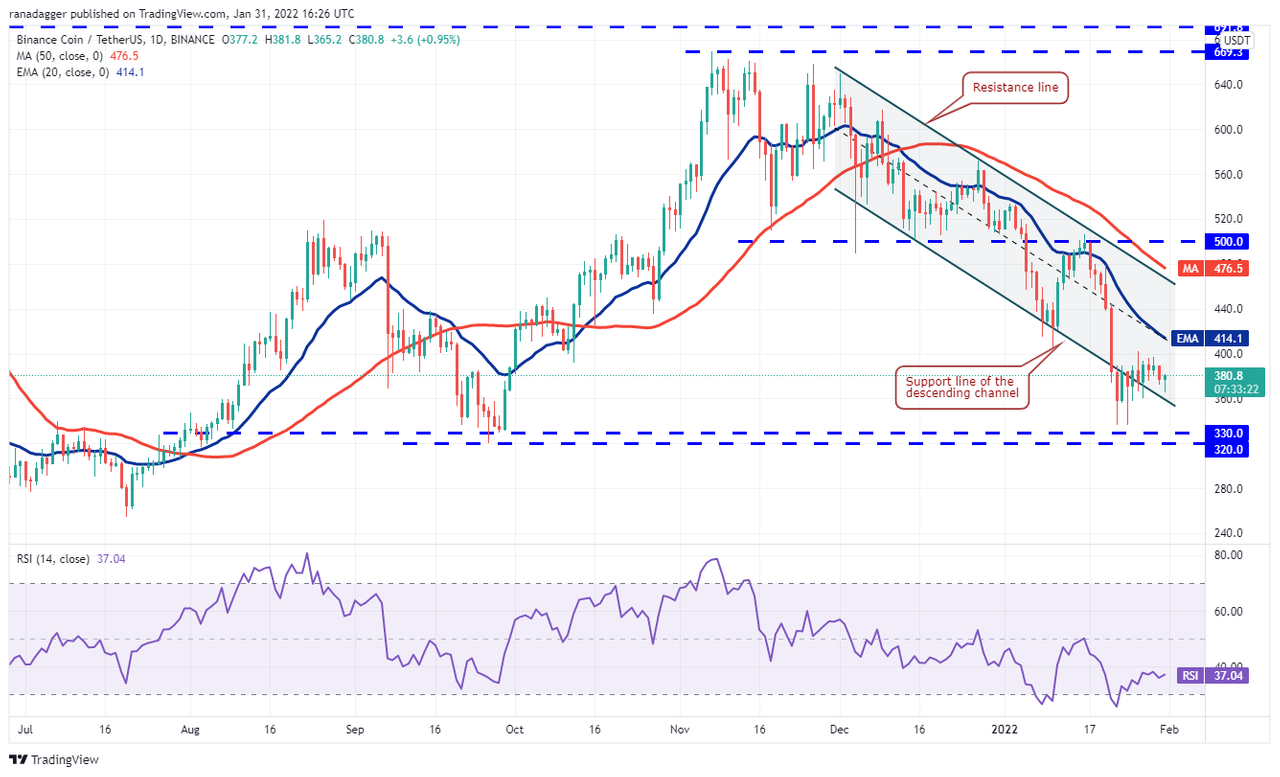
Bears are still much interested in pushing Binance Coin further down even though it's re-entry on Jan 25 hanged around 400, the BNB/USDT pair could again retest the critical support zone at 320. According to certain indicator analysis like the RSI, studies are showing that sellers are holding their positions strong. There could be a further dip to 320 is broken as traders are likely to sell in panic. This negative view will neutralize in the short-term on a break and close the 20-day EMA. Opening a space for a new rise in resistance line.
I would love to read from you think in the comment section, and if you guys like this kind of update I can be making them every month. Feel free to check other works I have put out too. HAPPY NEW MONTH TO YOU ALL : )
Replies (2)
Congratulations @easternface! You have completed the following achievement on the Hive blockchain and have been rewarded with new badge(s):
Your next target is to reach 800 upvotes.
You can view your badges on your board and compare yourself to others in the Ranking
If you no longer want to receive notifications, reply to this comment with the word
STOPCheck out the last post from @hivebuzz:
Support the HiveBuzz project. Vote for our proposal!
This post has been manually curated by @bhattg from Indiaunited community. Join us on our Discord Server.
Do you know that you can earn a passive income by delegating to @indiaunited. We share 100 % of the curation rewards with the delegators.
Here are some handy links for delegations: 100HP, 250HP, 500HP, 1000HP.
Read our latest announcement post to get more information.
Please contribute to the community by upvoting this comment and posts made by @indiaunited.