

Community post
Where could be next bitcoin bottom?
I include here a weekly chart i use often with metatrader 4 trading platform where you can see a price regression channel. Yellow line is the ALMA moving average, a particular kind of moving average that i like.
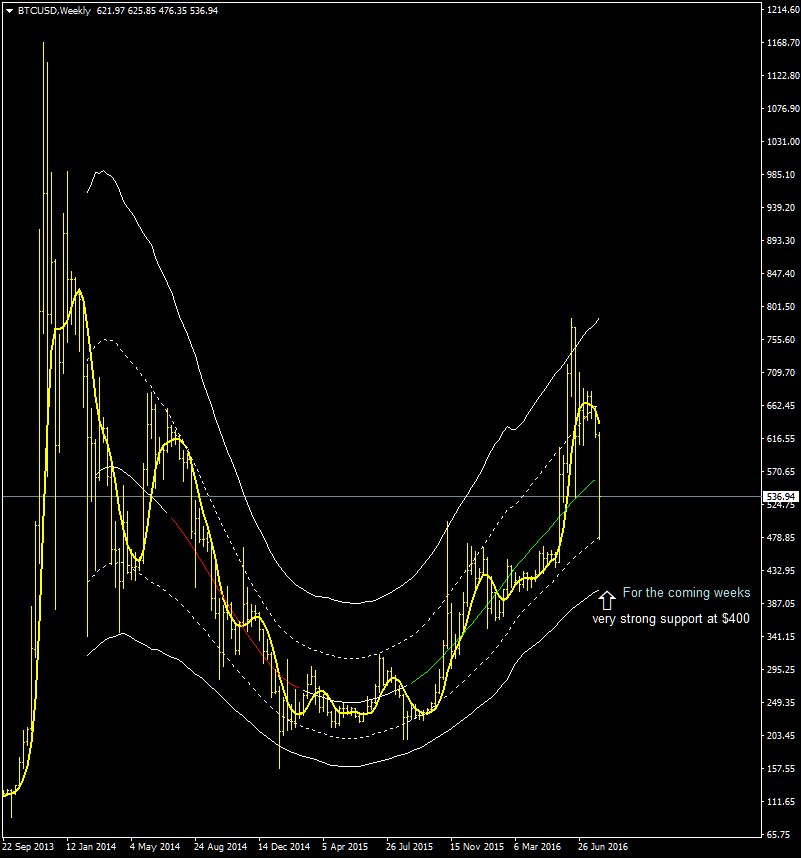
The dotted deviation lines are calculated using the volatility derived from the average true range indicator. The solid deviation lines are calculated with the same approach but using two times the value of the average true range. Most of the time XBTUSD stays inside the dotted deviation lines but during period of high volatility it moves towards the solid deviation lines as happened in the last Top of June 2016 at around $780.
With the bitfinex flash crash XBTUSD tested the first lower deviation line at 460. I don’t think is over yet, there might be a secondary reaction that can last all this month and maybe part of September with a test of the lower deviation line, this price level is near $400 as indicated in the chart.
The color of the mid-channel line represents the strength of the trend, red if bearish, white for neutral and green if bullish, at the moment the main trend is bullish and it’ll not change if XBTUSD doesn’t move below $400 for a prolonged period of time. I’m not going to liquidate my position as soon XBTUSD stays inside this long term bullish price channel.
My blog at https://btctrading.wordpress.com , bitcoin market coverage since 2011!
Replies (7)
Hi! This post has a Flesch-Kincaid grade level of 10.5 and reading ease of 64%. This puts the writing level on par with Michael Crichton and Mitt Romney.
Nice @enky
Shot you an Upvote :)
And also: Mining was profitable at 400.
Upvoted
Keep up the great work @enky
Upvoted
Good point, i really think it'll not go below $400
https://steemit.com/money/@rd7783/2eqte5-bitcoin-price-analysis-usdt-btc-on-poloniex