

Community post
COVID-19 cases for data analysis (2)
Last days US new cases rate is increased twice up to 10K new cases per day.
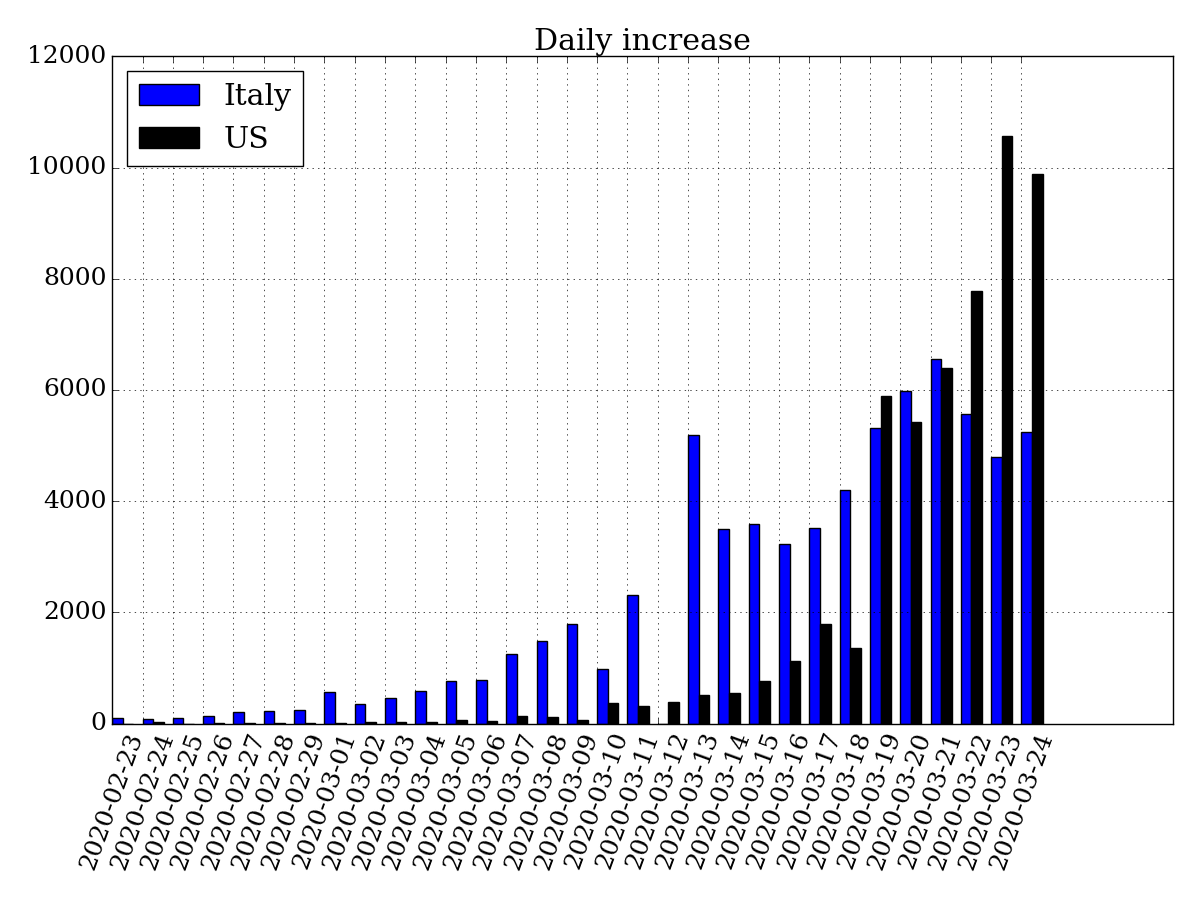
Total confirmed cases in US already outrun other countries and could exceed Italy cases quantity soon.
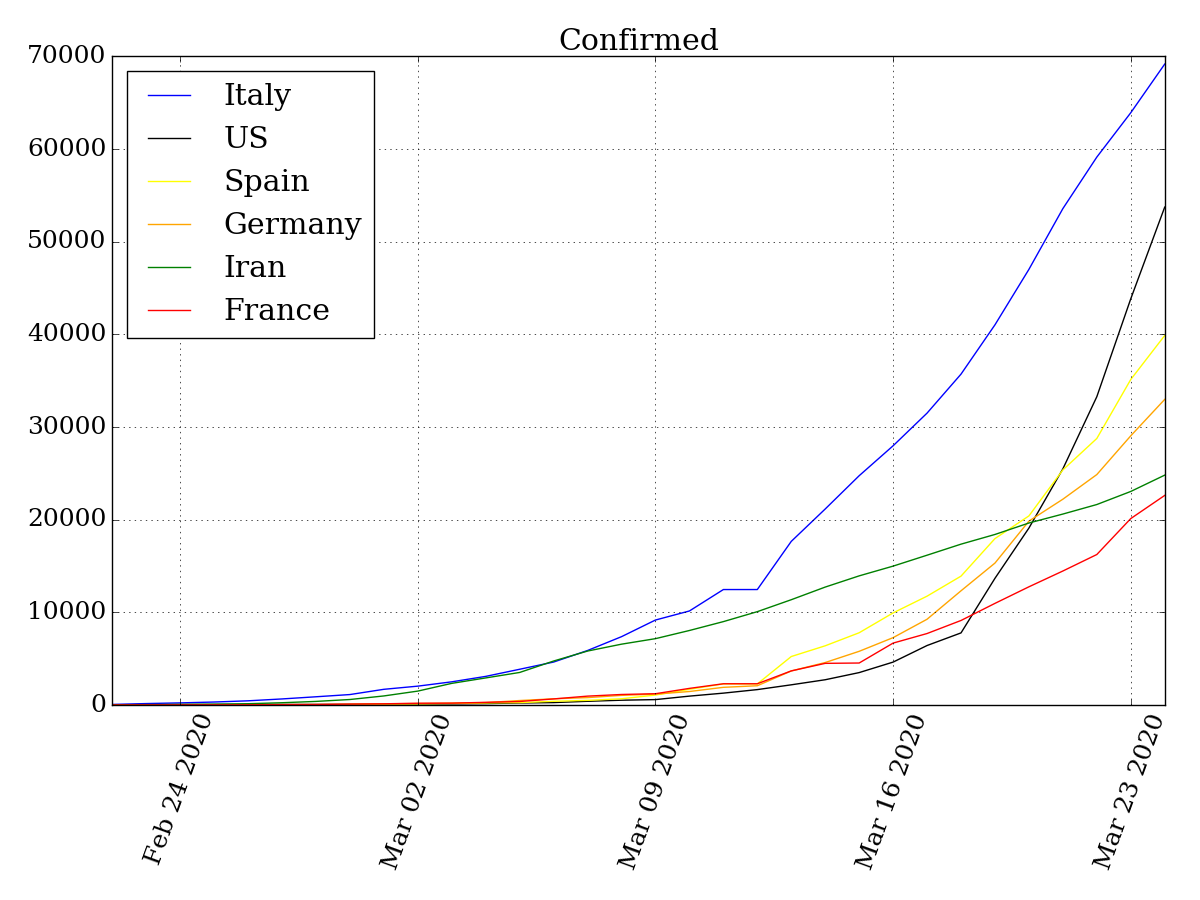
Data source: CSSE at Johns Hopkins University -> github
Python code using Pandas:
df = pd.read_csv("./csse_covid_19_data/csse_covid_19_time_series/time_series_covid19_confirmed_global.csv")  # new data file

...

def country_increase(name):

    count = []
    for i in range(0,num-1):
        count.append(incr[name][i+1] - incr[name][i])
    return count

count = {}
for country in ("Italy", "US"):
    count[country] = country_increase(country)

index = np.arange(len(data.index[1:]))
result = pd.DataFrame(count, index=index)
bar_width = 0.35

plt.bar(index, result["Italy"], bar_width, color="b", label="Italy")
plt.bar(index + bar_width, result["US"], bar_width, color="k", label="US")
plt.title("Daily increase")
plt.xticks(index, data.index[1:].strftime('%Y-%m-%d'))
plt.xticks(rotation=70)
plt.legend(loc=2)
plt.tight_layout()
plt.show()
Please see my previous post for more details: 1
Replies (0)
Conversation
No replies yet
Replies will appear here as people join the conversation.