

Community post
How to Trade Cryptocurrencies
How to Trade CryptoCurriencies
Vital to becoming a successful Trader
-
Patience.
-
Discipline.
-
Money/risk management.
-
Trading system.
The purpose of this Blog is to document a system that has proven to be an extremely accurate and consistent method of generating buy and sell signals for a wide variety of market trading vehicles including stocks, futures, forex, cryptocurriencies and commodities on various time frames. The system entails using renko charts in various time periods to confirm buy/sell entries. Moving average crossovers, commodity channel index (CCI), moving average convergence divergence (MACD) and the three ten oscileator are use to confirm buy/sell signals and entry points. Murrey Math indicator is used to indicator support/resistance areas.
Eminis wiill be used as the trading vehicle to illustrate the trading system.
What You Need To Start
-
A complete knowledge of the stock market terms and methods of operation.. Investopedia is a great resource of information for traders. Must read: The Disciplined Trader
-
An account with a broker who offers trading capability in a wide variety of instruments.. Some recommendations Interactive Brokers, Tradestation, Ameritrade.
-
Access to a chart service that is flexible and programmable. I use Sierra Charts but Tradestation provides an excellent charting systen.
MA Crossovers
Price action is the only true real time trading signal. Sustained price movement or trend is measured by moving averages or the change of price over a period of time. Recognizing trend changes are the most important factor when deciding when to enter a trade.
A MA Crossover is a method of generating buy and sell signals based trend changes or a short term moving average crossing a longer term moving average. Different MAs can be used depending on individual preference. I prefer 5 and 10 moving averages in generating crossovers in the short term and confirmations of longer terms including 5/20, and 5/35.
Good explanation here of what a moving average is:
http://www.investopedia.com/terms/m/movingaverage.asp
Overbought and oversold conditions can exist for extended periods or time and patience is required before entering a trade.
Stochastics divergence, price making higher high or lower low while stochastics do not, is also a sign of a trend change about to occur. http://www.investopedia.com/articles/trading/08/price-momentum.asp
Renko Charts
Renko charts are the best charting system I found to vizualize trend changes and eliminate mixed signals that occur in short terms.
The renko bar size can be adjusted to the instrument you are trading and the time frame you trade. Longer time frames give a better perspective of trend and help eliminate chop periods when markets move up and down in consolidated range.
There are many ways of setting up charts:
http://www.investopedia.com/university/technical/techanalysis7.asp
http://www.investopedia.com/articles/trading/10/range-bar-charts-different-view.asp#axzz1YycxyN4W http://www.greattradingsystems.com/ninja-trader/1616/
It is best to experiment and change settings to arrive at what it best for you.
I prefer using Sierra Charts, although there are a number of charting providers that are also very good. You need a system that provides for settin alerts for various studies. I have audio alerts that indicate when moving averages cross, both up and down. Setting alerts for various time periods is important as it provides a wider prospective of price action.
One must determine the time period you wish to trade. Some people prefer to buy and hold, but with the extreme volatility in the cryptocurreny markets currently, it probably is wise to use a system to take advantage of the swings.
Risk management is key to limiting losses in any vehicle and small consistent profits are preferable to trying to hit home runs.
Following are some charts showing system generated buy/sell signals.
Included are BTC, ETH, and LTC charts. The charts on the left are daily charts and the charts on the right are intraday charts.


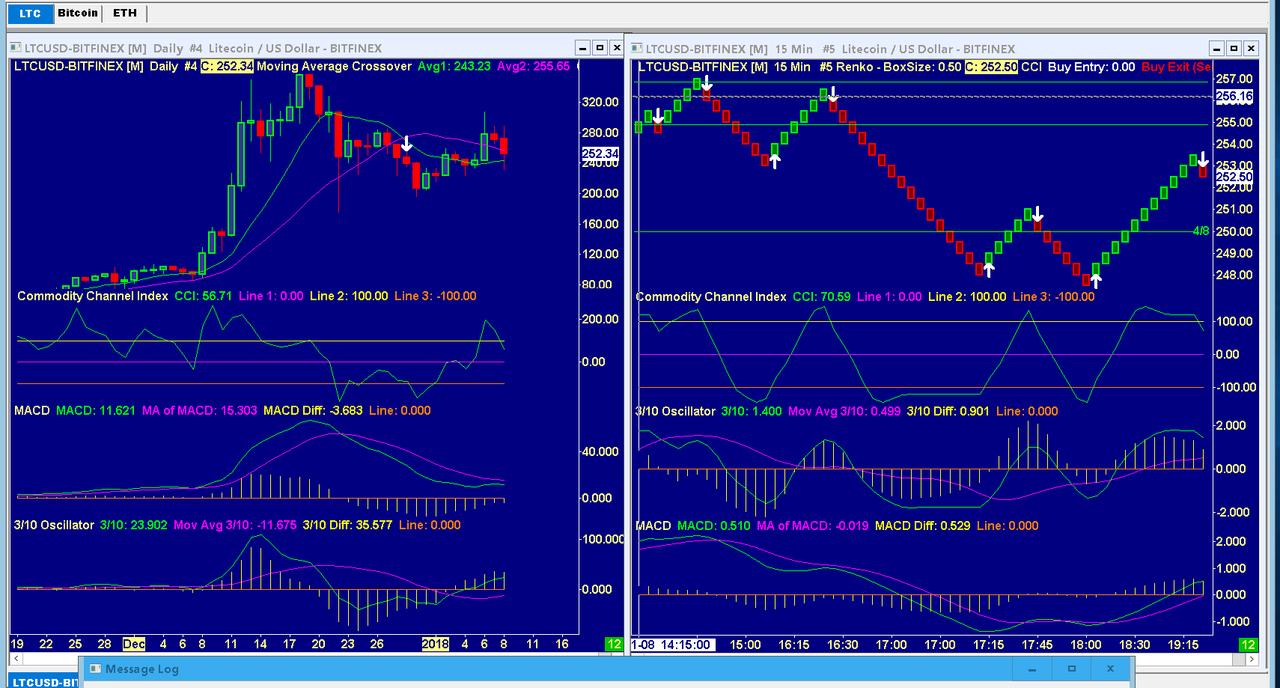
The white arrrows indicate buy and sell signals.
The system is designed to detect short term trend changes.
Pay close attention to slope changes of the moving average and the crossovers. For example the 5 EMA when it crosses the 10 EMA. A cross of the 10 EMA over the 20 EMA is confirmation.
For even longer time frames use daily, weekly and monthly 50/200 ma crossover to detect trend changes.
It is also very helpful to be mineful and mark with horizontal lines previous support and resistance areas on charts. Murrey Math Fractals are a great tool for indicating oversold/overbought areas. I use the Murrey Math lines as a indication and confirmation of reversals.
Included on the above charts are white arrows indicating buy/sell signals generated by Sierra's Spreadsheet System for Trading, an automatic trading study.
The charts include two NQ charts and an ES chart for reference.
Tips, Advice and Links
- Rules for Daytraders. http://www.rightline.net/stock-trading-online/online-stock-trading-tips.html
2 Never add to a losing trade. Get out of a losing trade quick. Minimize loses let winners run.
-
Do not have a futures trade on during market moving events. Let the trade develop. Economic Calender https://www.dailyfx.com/calendar
-
Check other world markets http://www.investing.com/indices/indices-futures
-
Have a consistent repeatable pattern https://www.moneyshow.com/articles/daytraders-17207/
-
Big Traders like to jamb the futures higher end of day especially during bullish markets. Friday end of day rallies are almost a given. Overnight futures gap up probably 80% of the time.
-
Before trading for real, practice. Interactive Brokers offers practice accounts and Sierra Charts allows for simulated trading and back testing your system.
-
During the day there are "chop zones" when prices will chop back and forth over a small range.
Do not attempt to trade during these chop periods, rather wait for clear signals. It only takes one or two trades a day to make decent profits. Don't attempt to outtrade the pros. They will steal your money especially at the end of day and overnigt sessions. Overtrading leads to losses. Wait for the favorable oversold/overbought setups with clear reversal signals.
Good Luck out there, trading is difficult. It requires extreme patience, concentration, disciplne and money management skills. If you do not master these skills you will lose money.
Replies (3)
Congratulations @jlitz88, you have decided to take the next big step with your first post! The Steem Network Team wishes you a great time among this awesome community.
The proven road to boost your personal success in this amazing Steem Network
Do you already know that awesome content will get great profits by following these simple steps, that have been worked out by experts?
Congratulations @jlitz88! You received a personal award!
Click here to view your Board
Congratulations @jlitz88! You received a personal award!
You can view your badges on your Steem Board and compare to others on the Steem Ranking
Vote for @Steemitboard as a witness to get one more award and increased upvotes!