

Community post
Bitcoin Chart Review and Update #55 ?
Bitcoin Chart Review
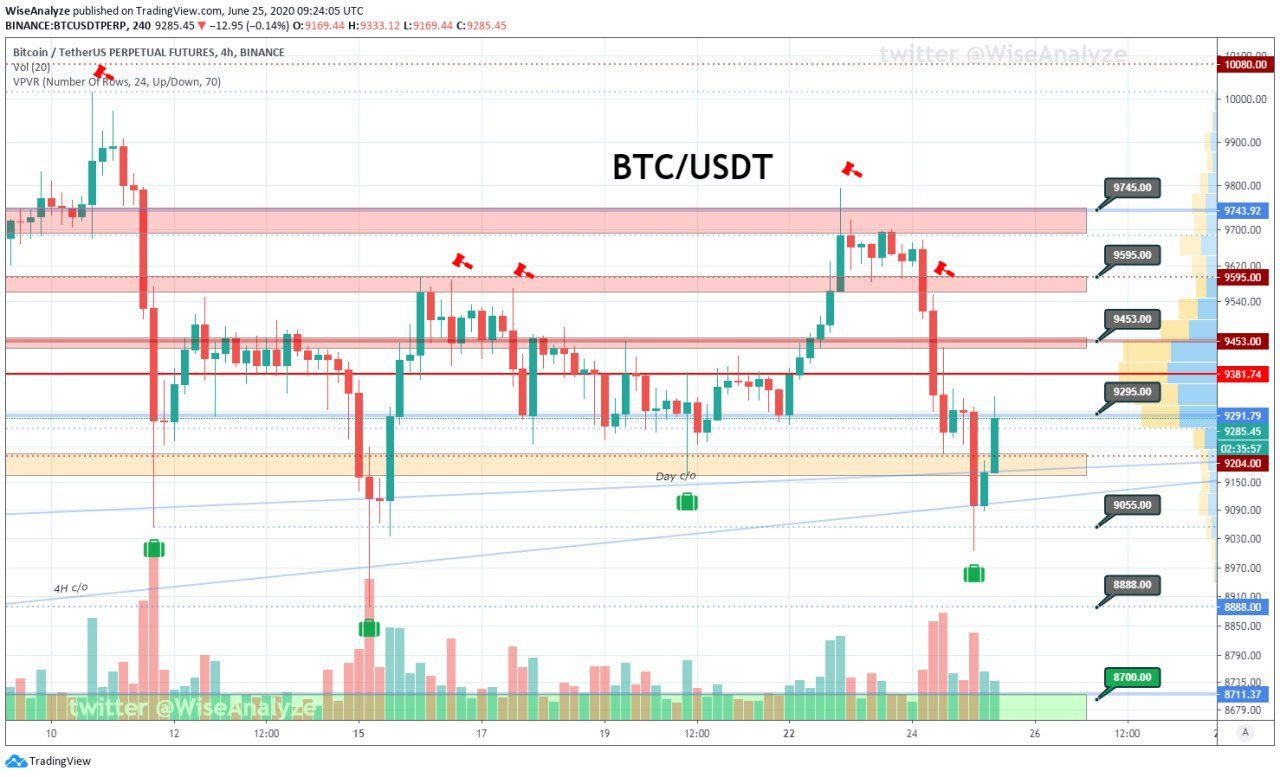
BTC Chart Published By Wiseanalyze at Tradingview
https://www.tradingview.com/u/WiseAnalyze
Comment: Bitcoin is not dumped hard yet and stopped support price at 9k, BTC now trading at $9200, Now Bitcoin Still in Short term Bearish But overall picture is turning bearish if 9k support not hold,
Middle scenario - re-test of ~9400 resistance and drop lower. Bullish scenario - pump higher to ~9600 - in this case bullish reversal possible. Bearish scenario is rejection from 9300. But I don't think we will see dump so early.
Keep in mind that Bitcoin traders and investors are braced for more than 100,000 bitcoin options totaling $930 million to expire Today - nearly 70% of bitcoin’s entire open interest (link). Therefore we may expect a HUGE volatility coming.
BTC Chart Published By Proanalysis
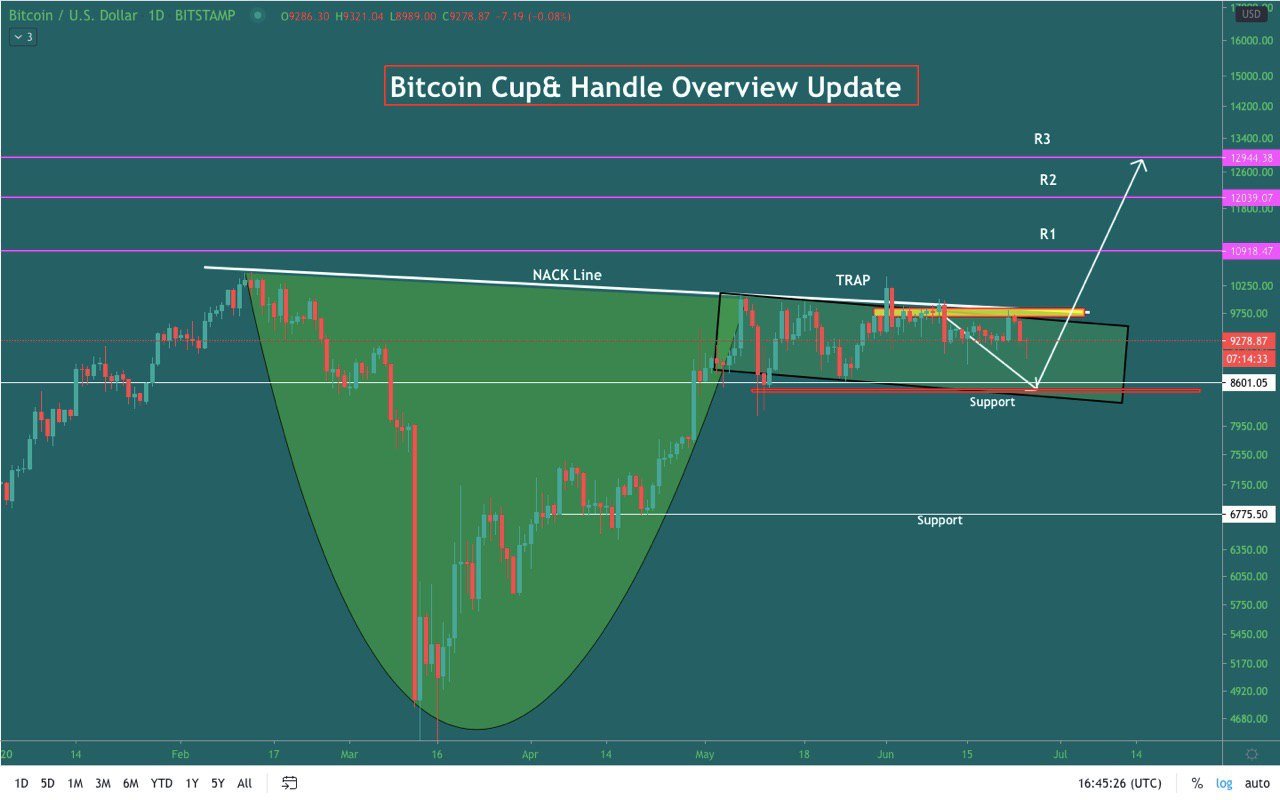
So if BTC follows same like Cup & Handle then we can expect BTC bottom would be 8500, So be prepare for Good entry.
If Bulls want to be in control then BTC price need break above 1000010000 with High Volume.
Res-9300 - 9450 - 9600 - 9745 - 9880
Sup-9050 - 8888 - 8666 - 8530 - 8300
Fear & Greed index: 43 (<= 50 <= 41 <= 38)
BTC Dominance: 64.4% (<= 64.6 <= 64.7 <= 64.6)
24h Volume: $73 billion (<= 63 <= 71 <= 59)
#BTC #Bitcoin (TradingView)
Posted Using LeoFinance
Replies (0)
Conversation
No replies yet
Replies will appear here as people join the conversation.