

Community post
BNBUSDT Technical Analysis
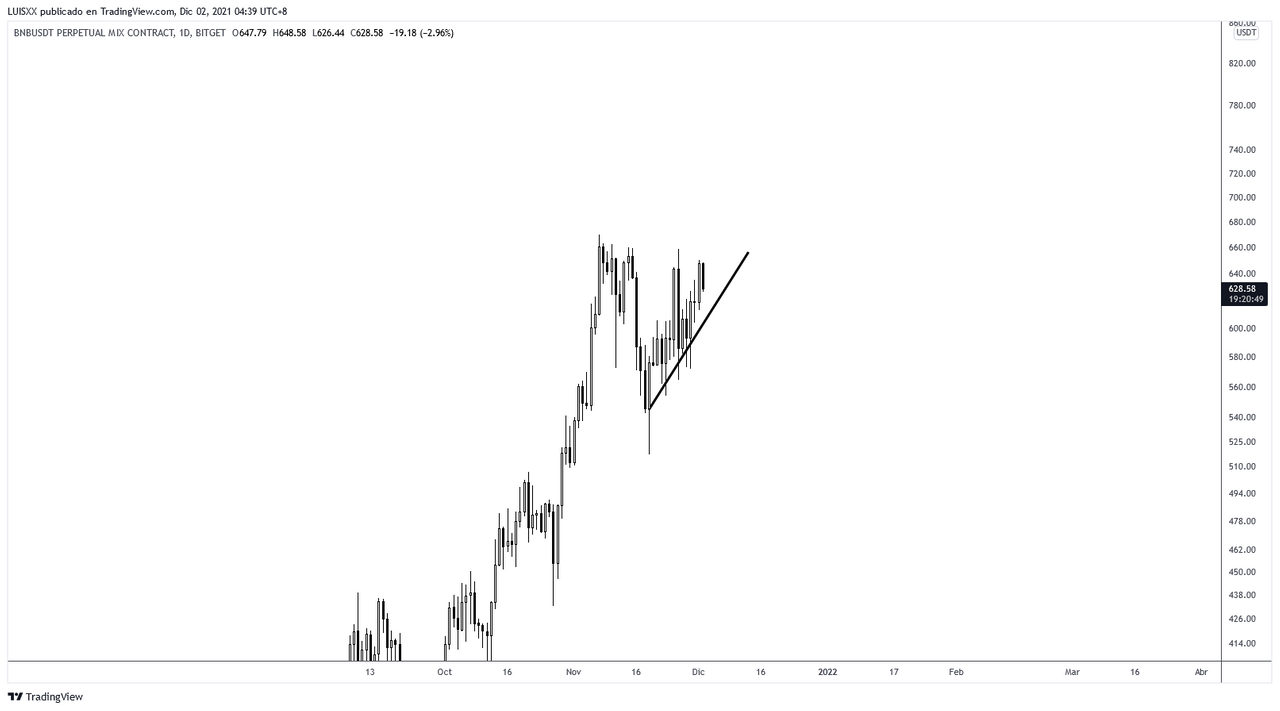
BNB within the 1D timeframe is performing a bullish triangle, the support line has remained strong in the last 2 weeks.
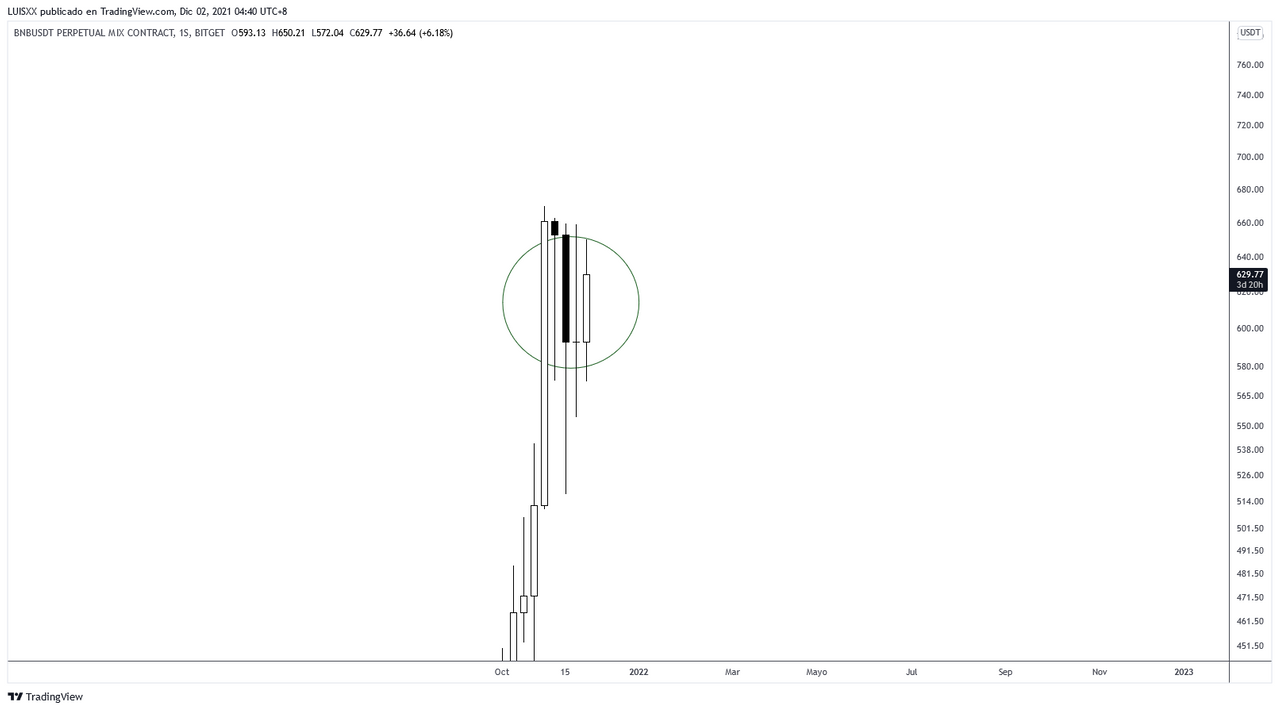
In the image above we can see how within the 1W timeframe the price is forming an excellent bullish candlestick pattern, the previous close was a doji with strong accumulation, if the current candle closes with good volume, we should see the price reach or exceed $700 for the next few weeks with clear expectations to look for higher price levels in the medium term.
Posted Using LeoFinance Beta
Replies (0)
Conversation
No replies yet
Replies will appear here as people join the conversation.