

Community post
AEX TA - 30-10-2018
1M
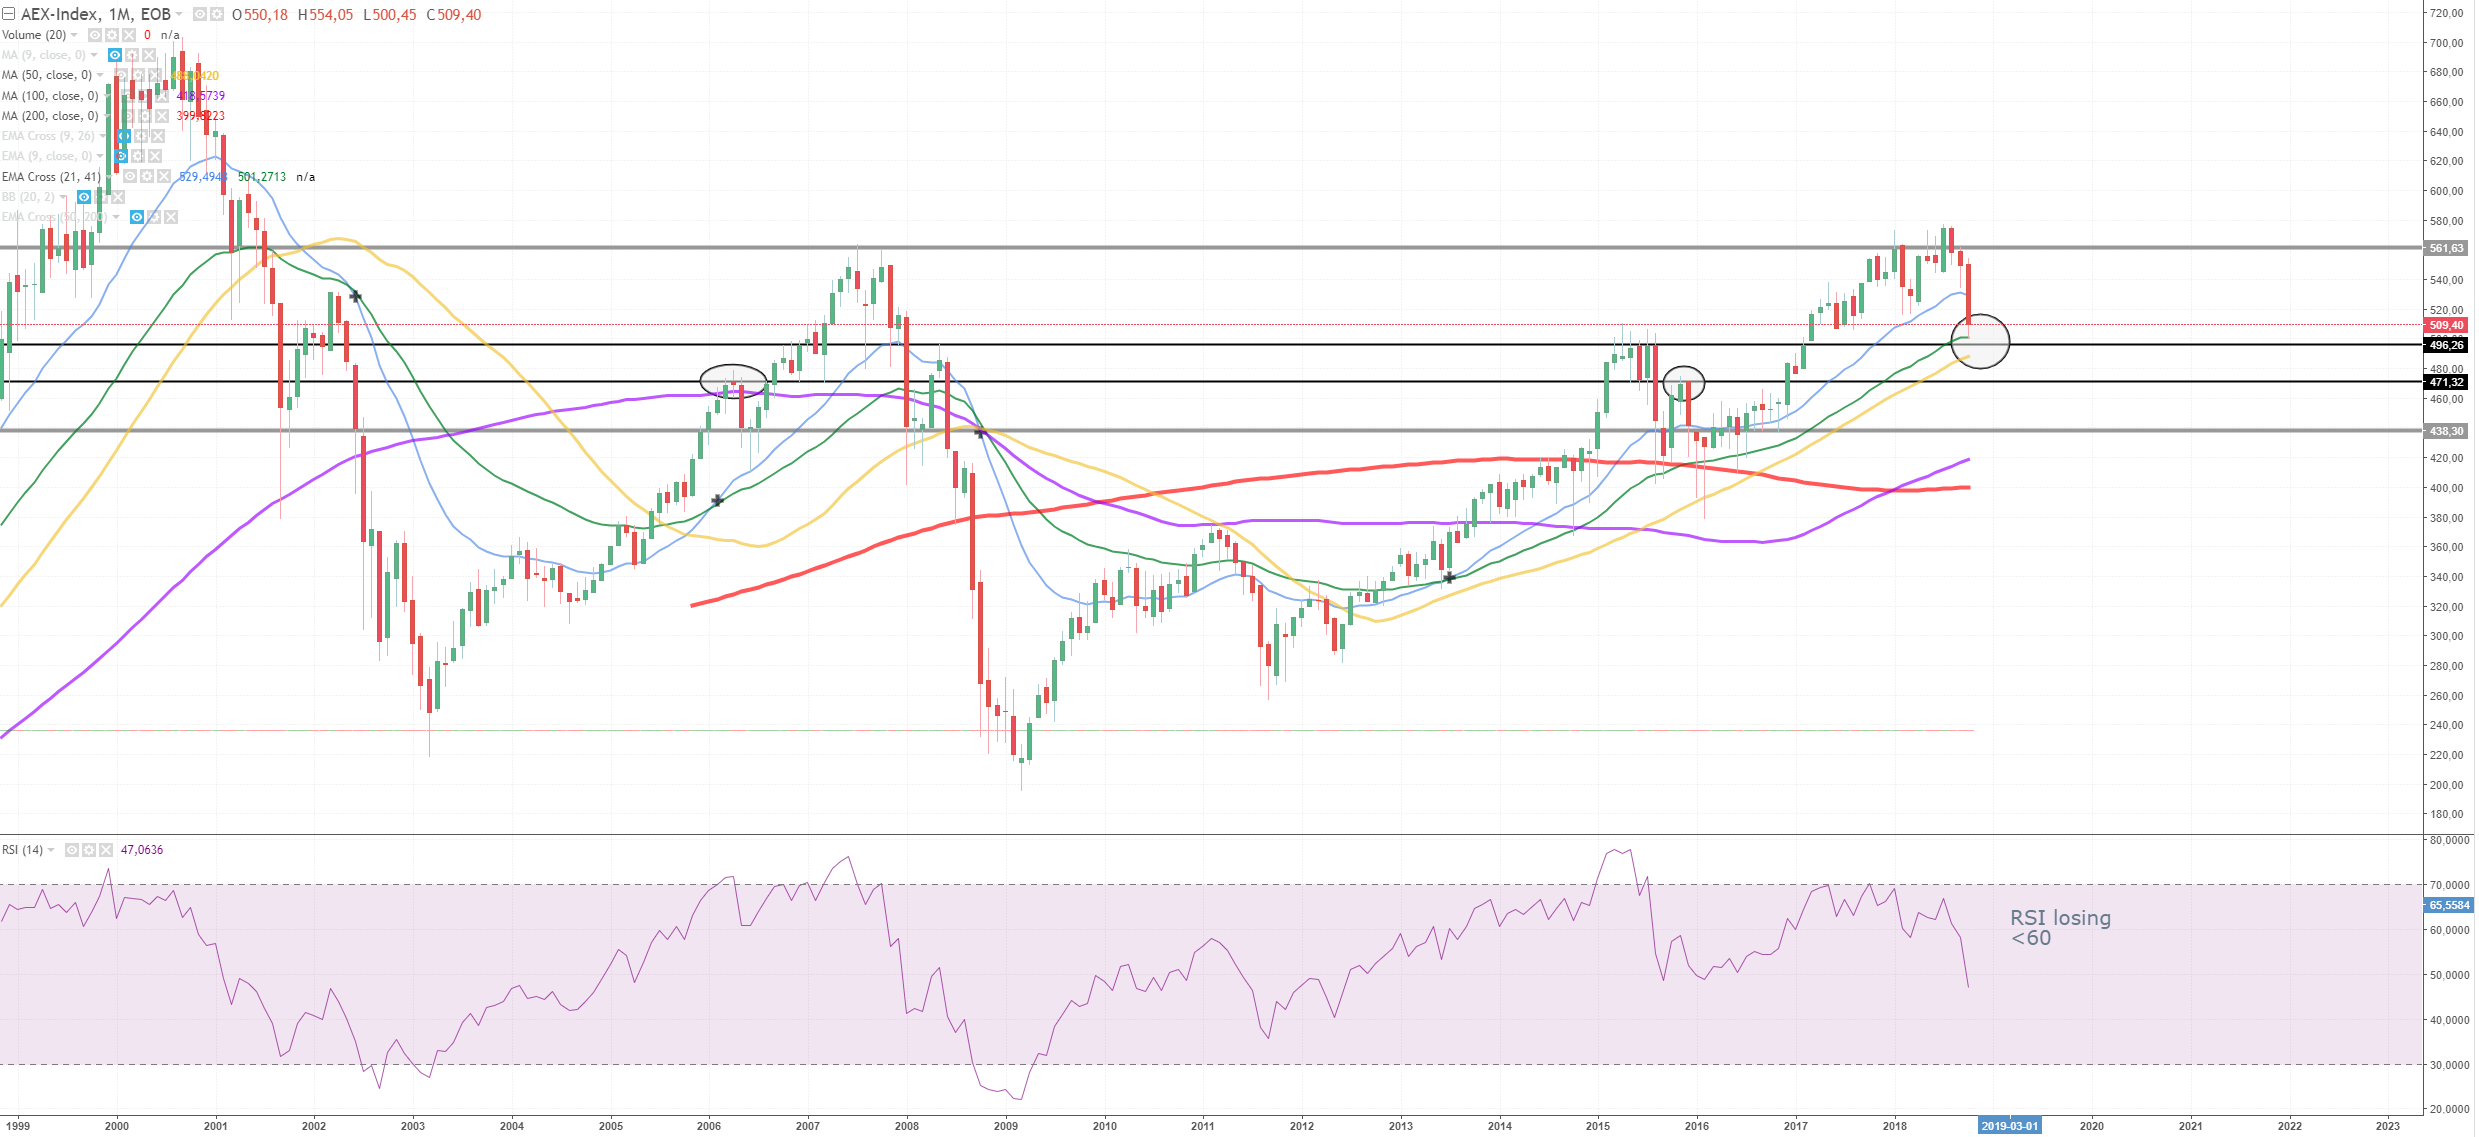
There is quite some support on the 496 level on the AEX. There is the ema41 support, ma50 support and previous top support. And it will be quite a hassle to break through looking like this.
We might see some difficulty's around 471 and slightly above (peaks from previous resistand/support).
If we finnaly reach 438 we could fall down hard, also because the ema cross will be formed. But the ma100/200 support will likely show some resistance. But they can't win from an ema cross.
RSI is also losing, going <60 into bear-mode.
1W
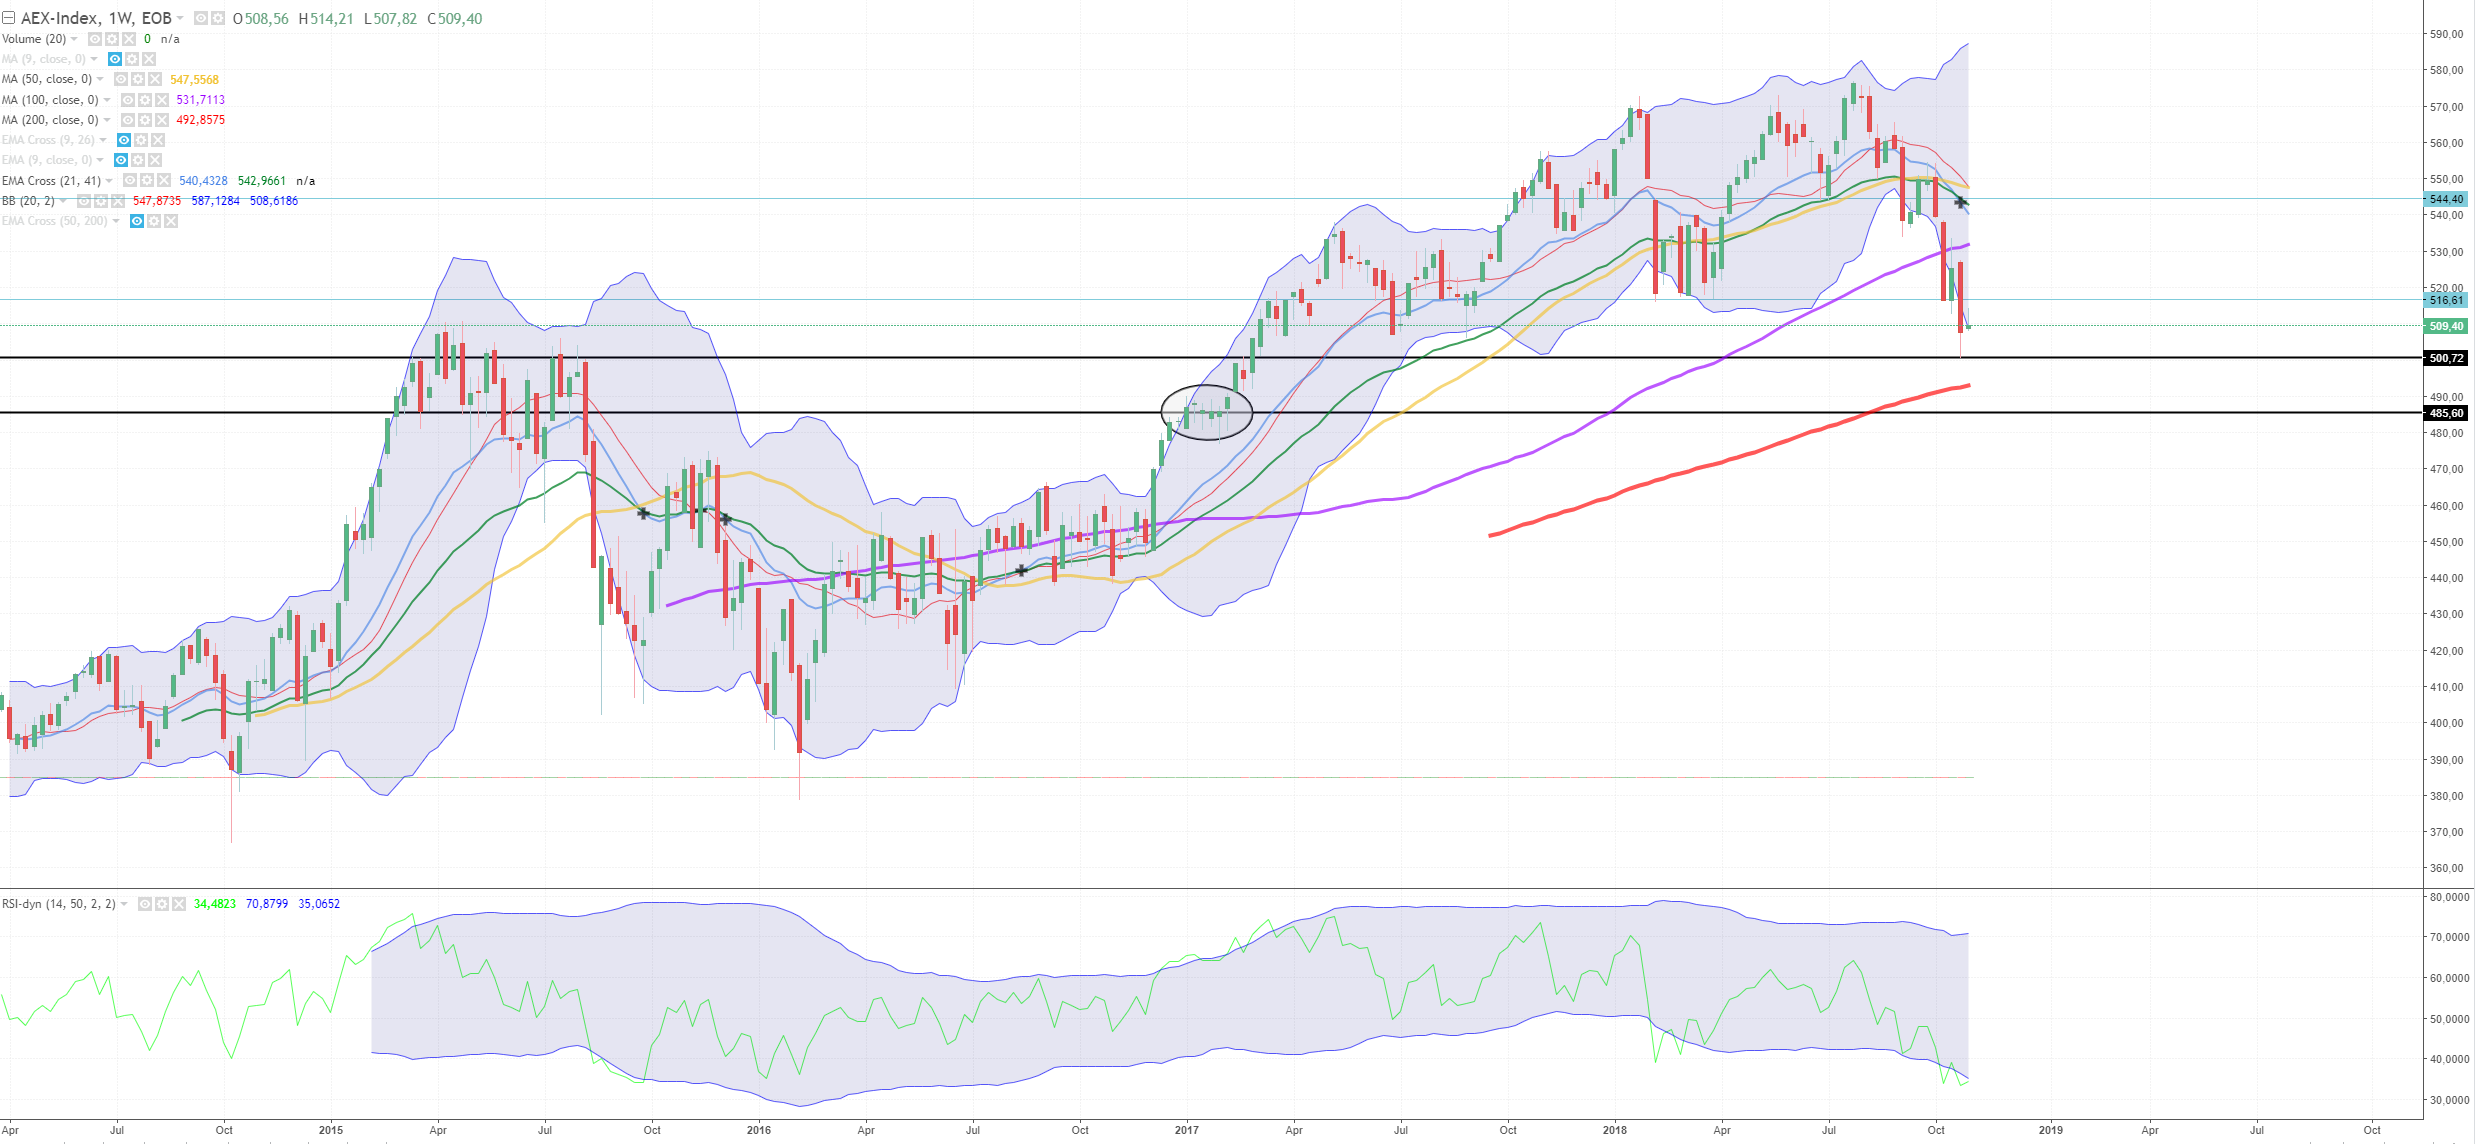
For the week-chart I like to use the Bollinger Bands, we are quite sometime out these band or on it's edge. It will be time to move inward, side-ways or having a correction. The Dynamic RSI shows us the process when we breach outside the bollinger bands, which will likely result in a correction.
We could see some new resistance around 516.
Also the ema lines crossed in this chart. And around January 2017 there was some accumilation showing upcoming support.
1D
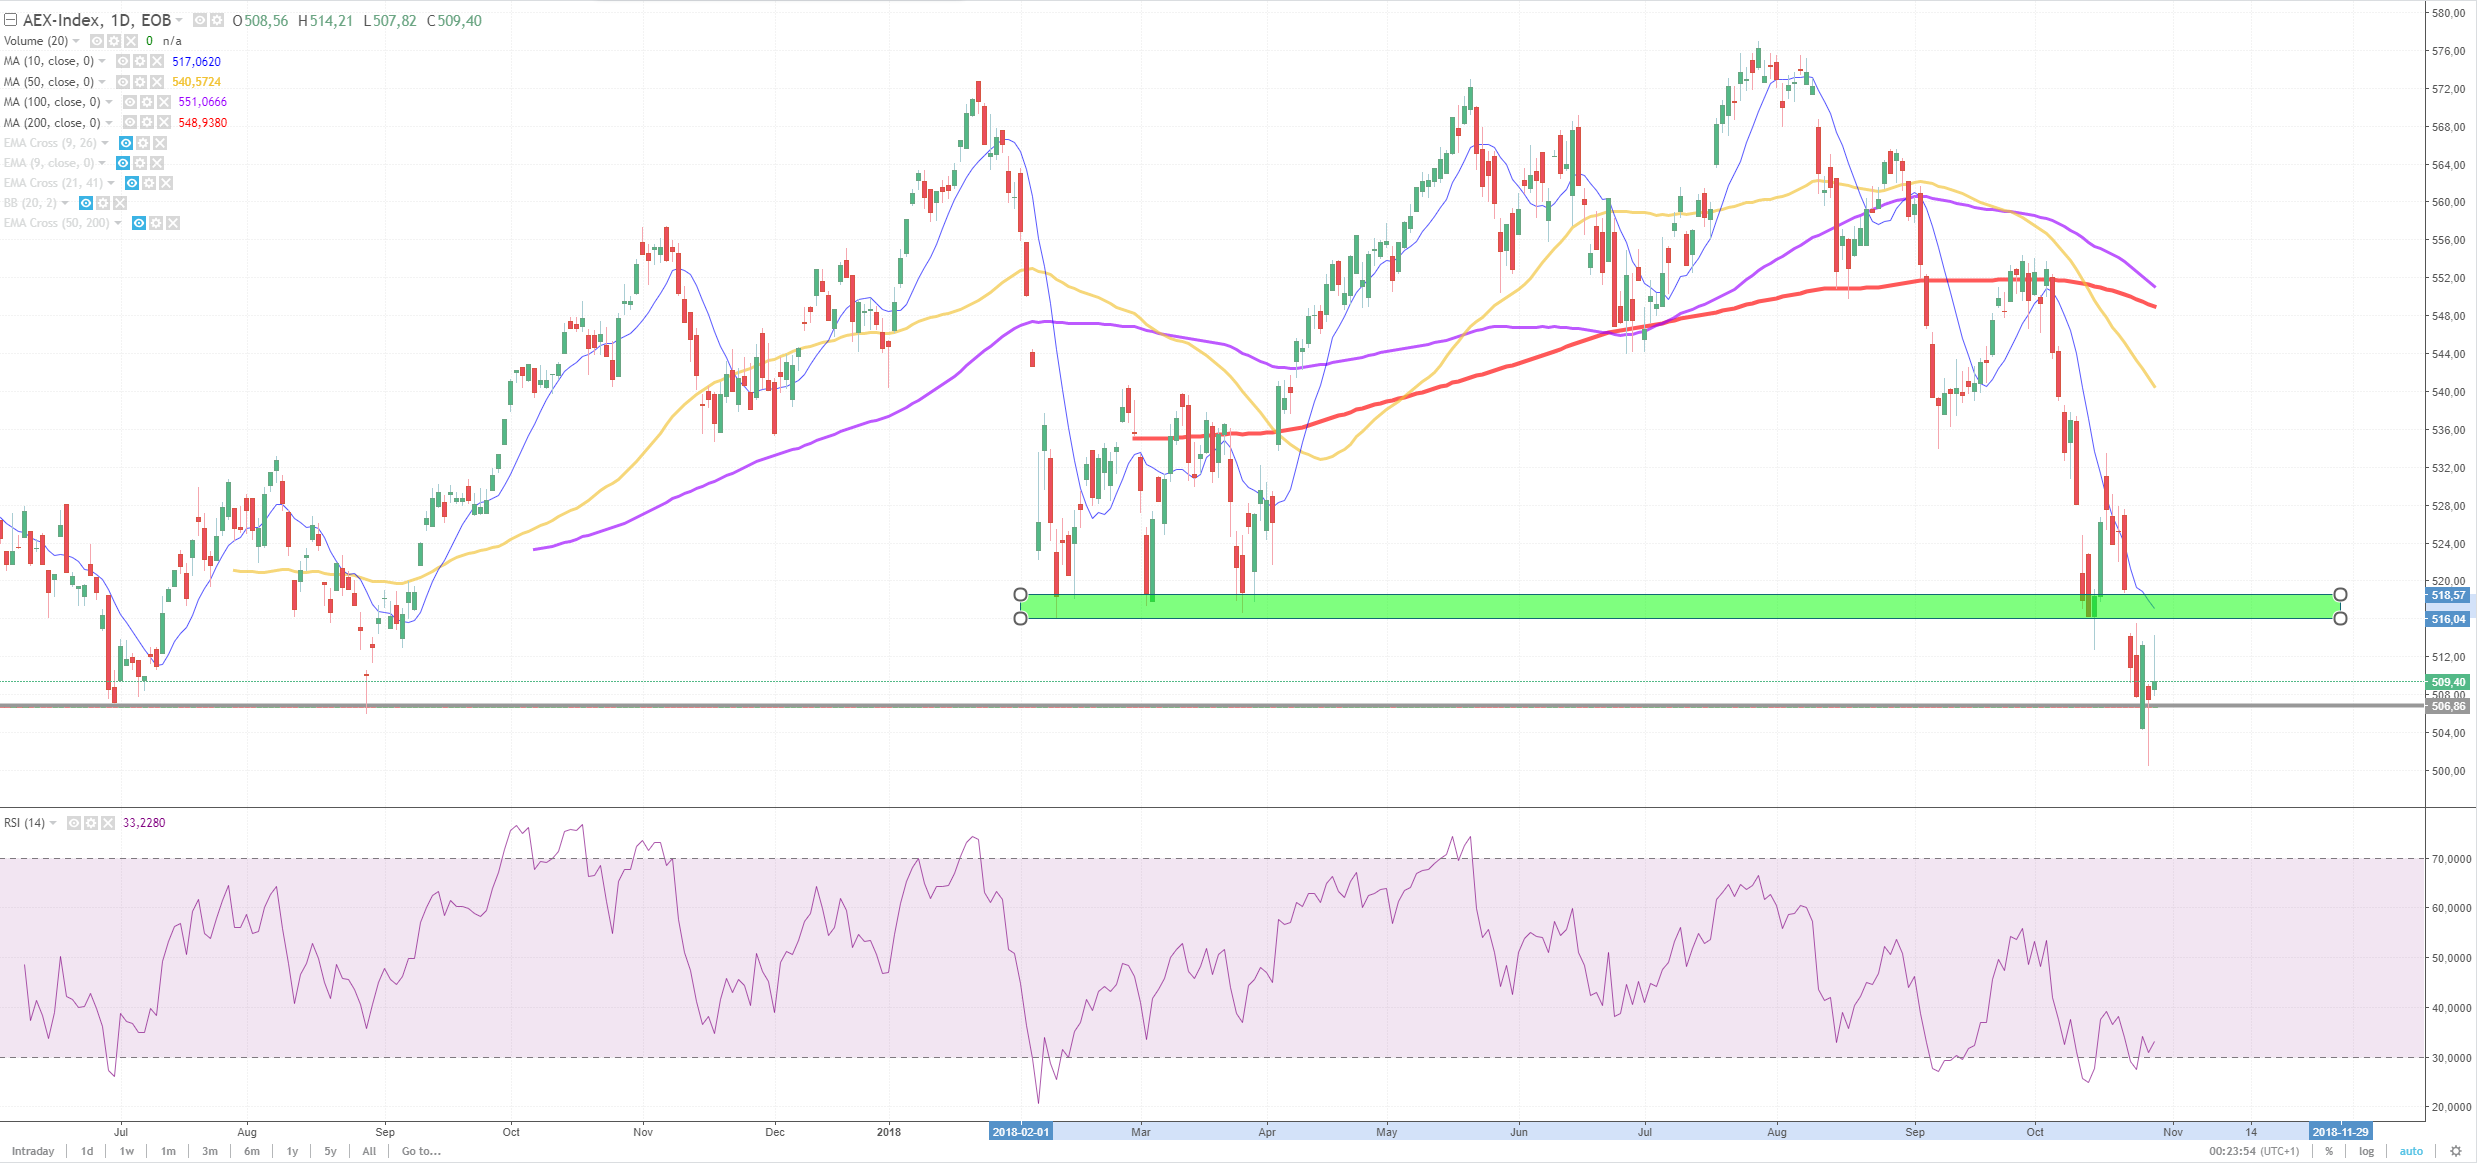
There are some spikes and a red hammer seen on the daily-chart. We could see a correction to the green area at 516-518. This correction corresponds with the ma10 . If we want to breach to a new support level we'll have to go down through the 506 support. See higher time-charts for support below these levels.
1H
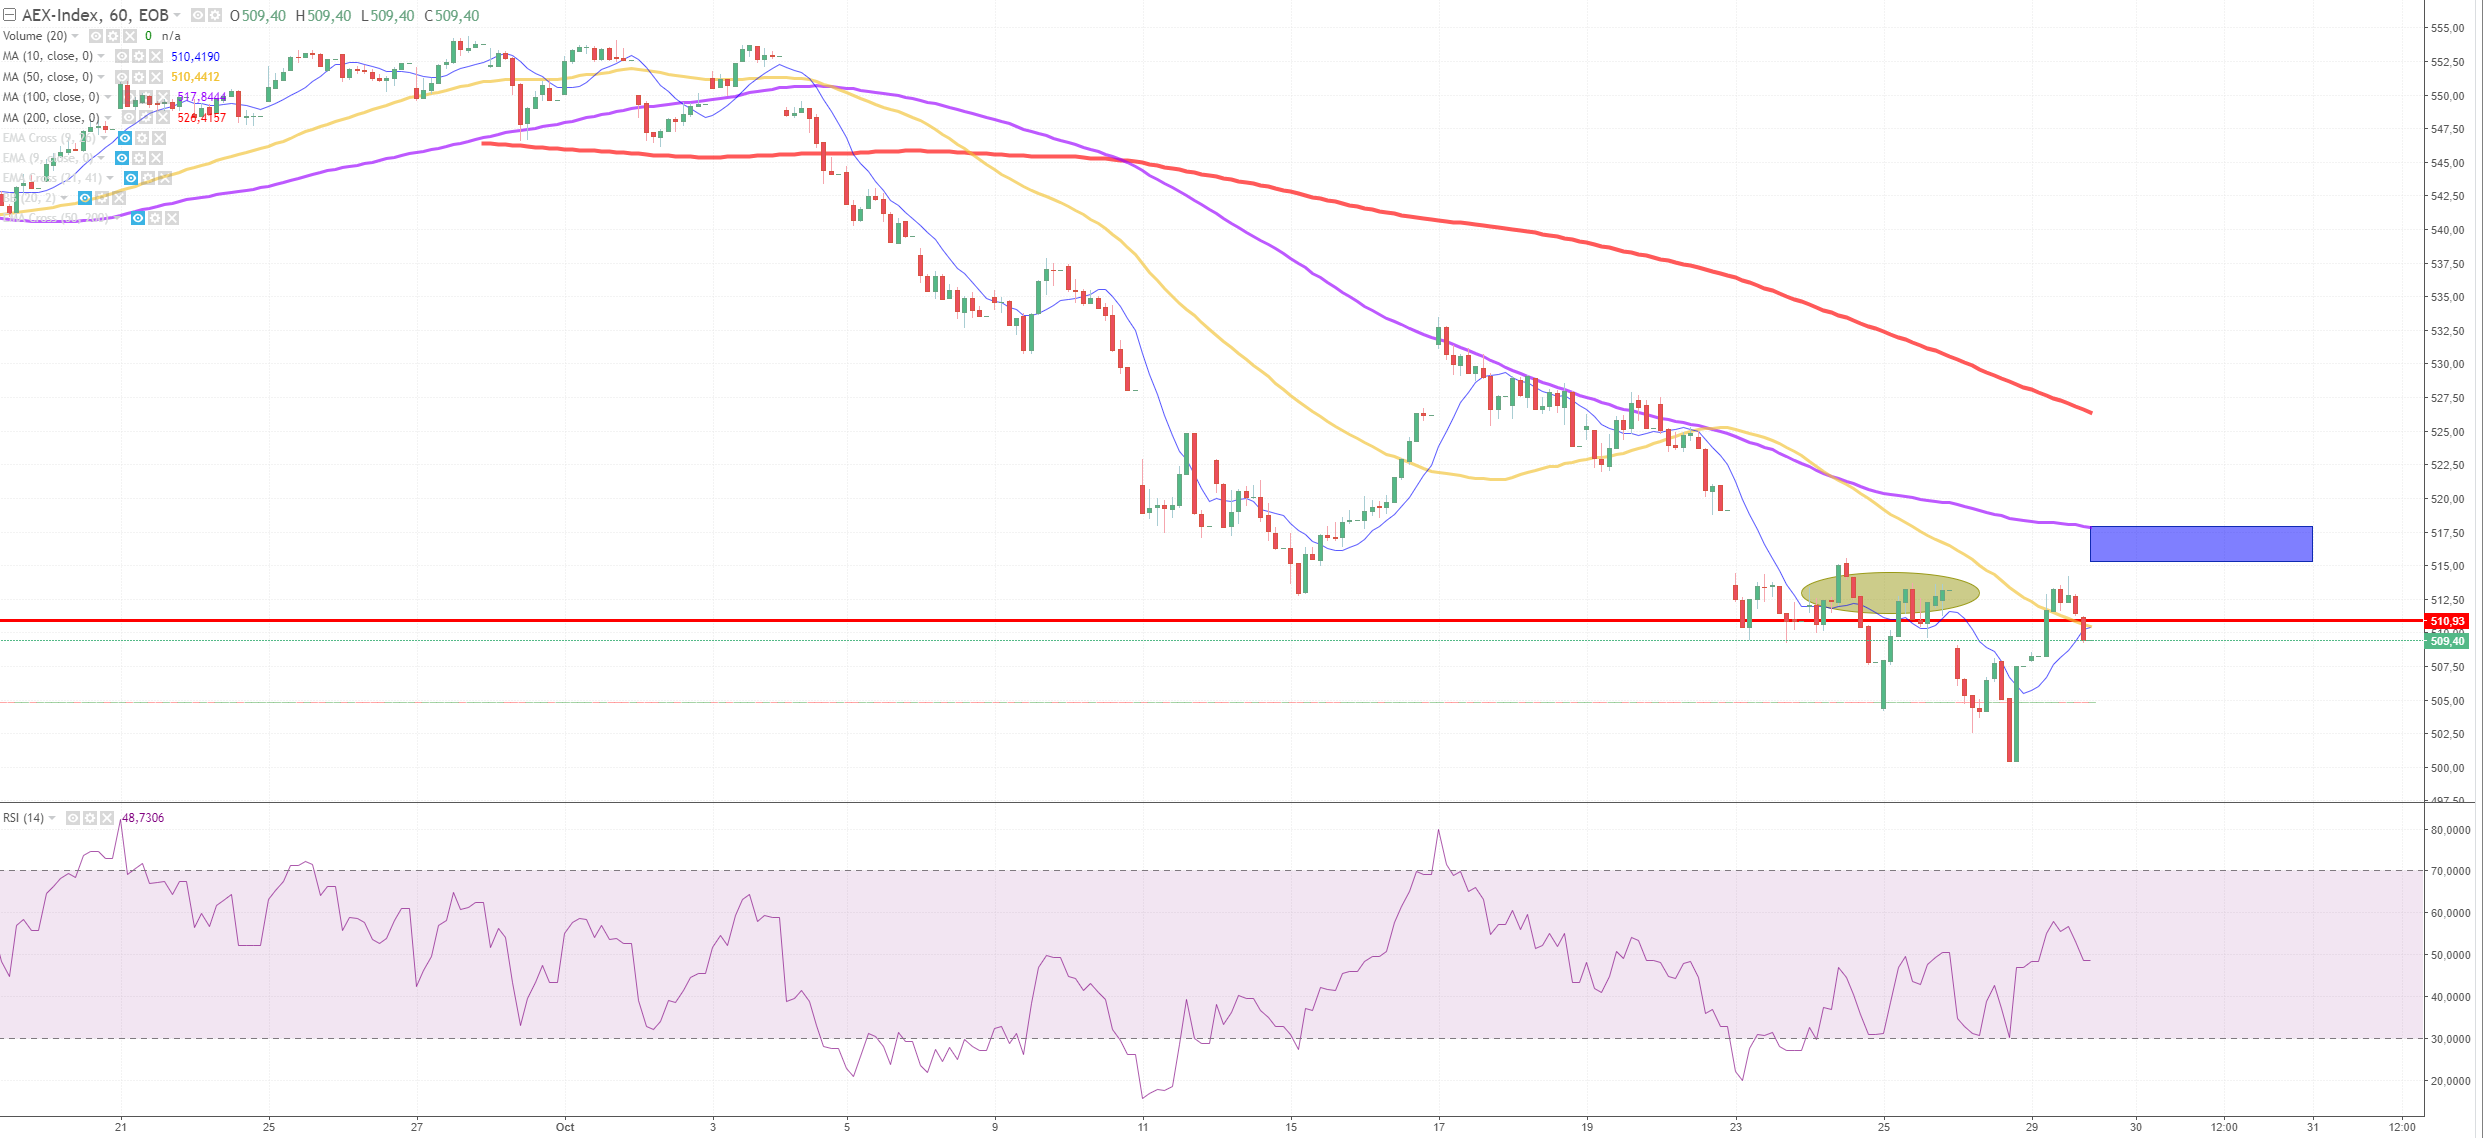
For upcoming day (30-10-2018) we can see ma10 crossing > ma50. Which could result in a slight uptrend, likely to go to the ma100 line (blue) and we could reach the 515-517 area. which is around the area stated on the day-chart.
But I have to be honest, the IEX24 chart which corresponds with the AEX is already down to 505 meaning that the ma10>ma50 could fail. And that means the ma100 support swifts to a lower level, to ma50 support and eventually followed by the ma10 support. So prepare well for this market during it's first half hour! And check it's direction! If we end up being bullish tommorow, we will likely go to this blue area. If we are bullish we will fall harder and we have to check some higher time-frame charts.
Replies (0)
Conversation
No replies yet
Replies will appear here as people join the conversation.