

Community post
Is Bitcoin trend mimicking 2014?
BTC price reached all time high (ATH) in mid December 2017 and has been almost halved since then. Is this a healthy correction or bear market?
Maybe history can give us a hint. BTC was bullish from the end of 2011 until the end of 2013, followed by a bear market with a bottom in the beginning of 2015 and consolidated to the end of 2015. Then it rised up and reached ATH at the end of 2017. These are cycles of 2-year interval, probably due to the number of BTC generated per block decrease 50% about every four years. Then what may happen next?
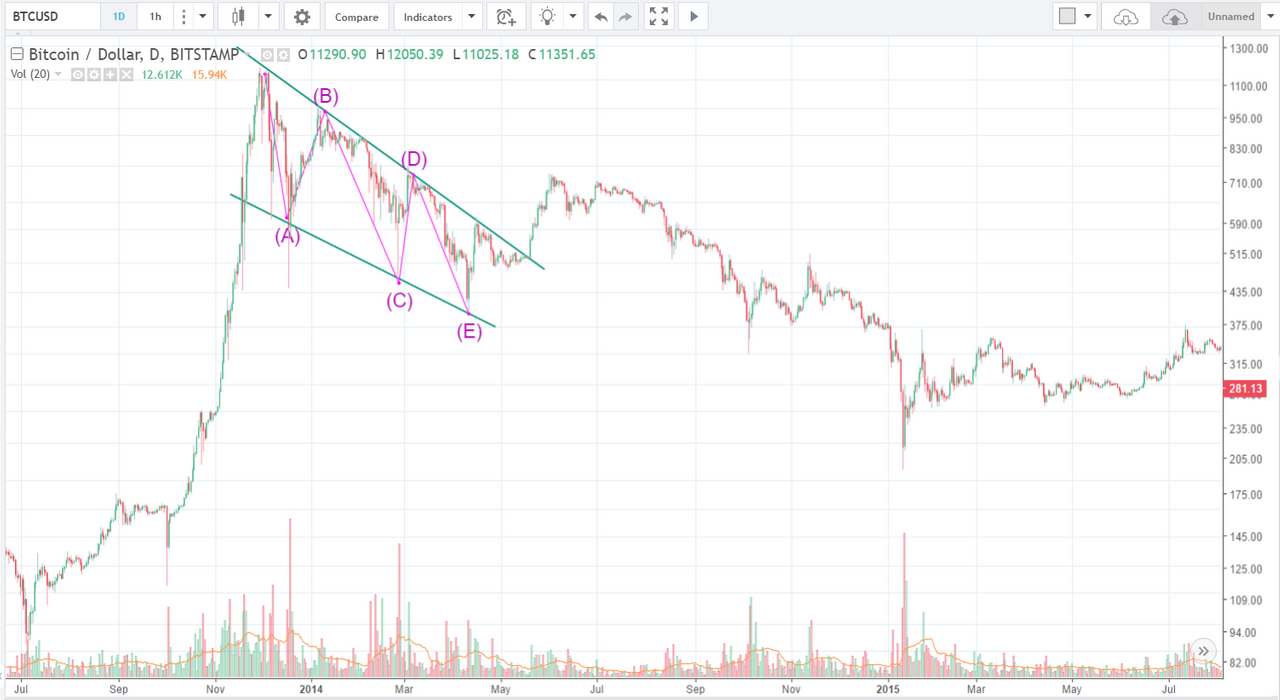
In the above 2014 price chart, correction Wave A had ABCDE pattern, then a bounce back as Wave B which doubled the price, and followed by Wave C correction.
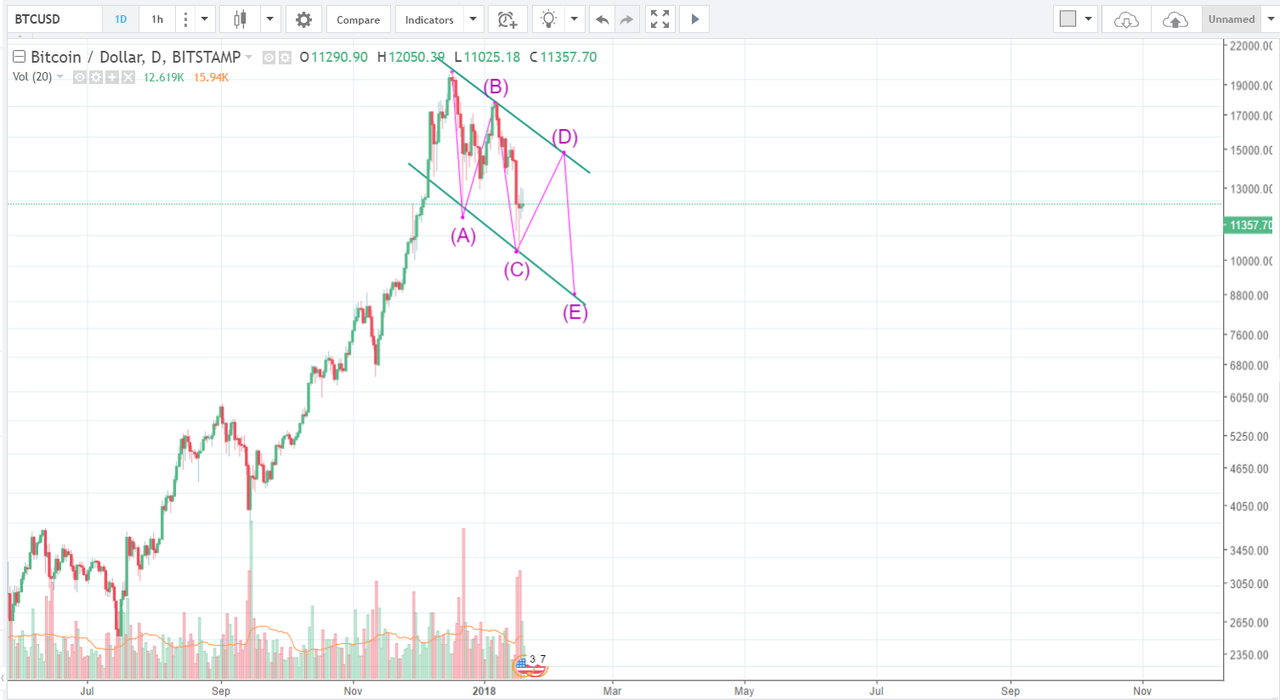
At this moment BTC price looks like is at subwave D of correction Wave A. If fractal plays and history repeats itself, we probably have already entered bear market and the price may reach the bottom in the beginning of 2019.
Disclaimer: This is just my personal opinion, but not financial advice or recommendation.
Replies (1)
Congratulations @patrickzhou! You have completed some achievement on Steemit and have been rewarded with new badge(s) :
Click on any badge to view your own Board of Honor on SteemitBoard.
For more information about SteemitBoard, click here
If you no longer want to receive notifications, reply to this comment with the word
STOP