

Community post
ETHEREUM PRICE TREND ANALYSIS
In yesterday’s analysis, we saw a connecting bearish trend line at 370. The worst thing was a break below a major support area at 360, 345 on the hourly chart of ETH/USD. The last break was below the 100 hourly simple moving average at $353.
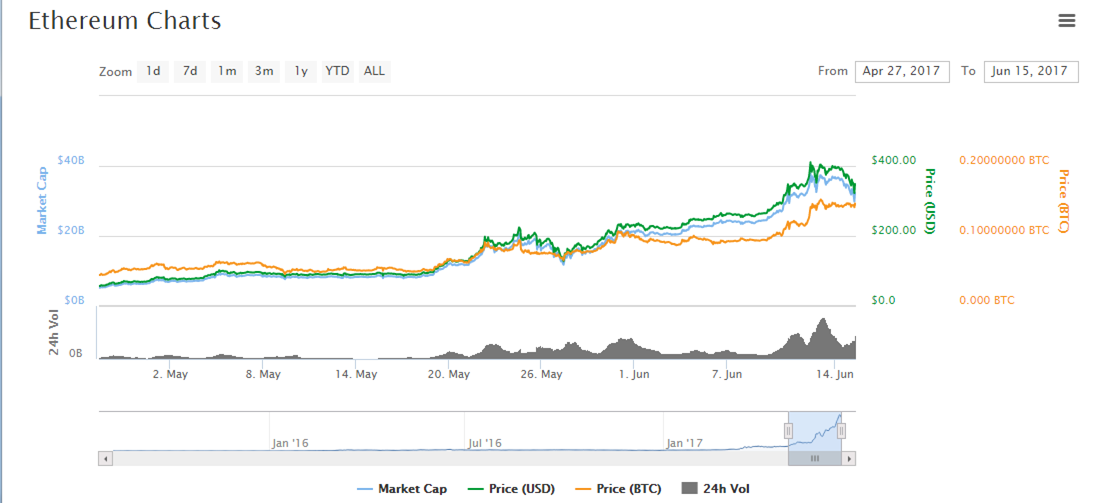
These all are short-term bearish signs, and as it can be seen from the chart, the price fell and traded towards 310 support area. At the moment, the price is recovering, and trading above the 23.6% Fib retracement level of the last decline from the 310 low. However, there is a major resistance forming at 360.
Replies (1)
Congratulations @rajdharma! You have completed some achievement on Steemit and have been rewarded with new badge(s) :
Click on any badge to view your own Board of Honnor on SteemitBoard.
For more information about SteemitBoard, click here
If you no longer want to receive notifications, reply to this comment with the word
STOPBy upvoting this notification, you can help all Steemit users. Learn how here!