

Community post
Forex Technical Analysis 24S18
The strategy is simple: I am selling/buying bounces from trendlines (not all trendlines some are there to determine a position for a take-profit).
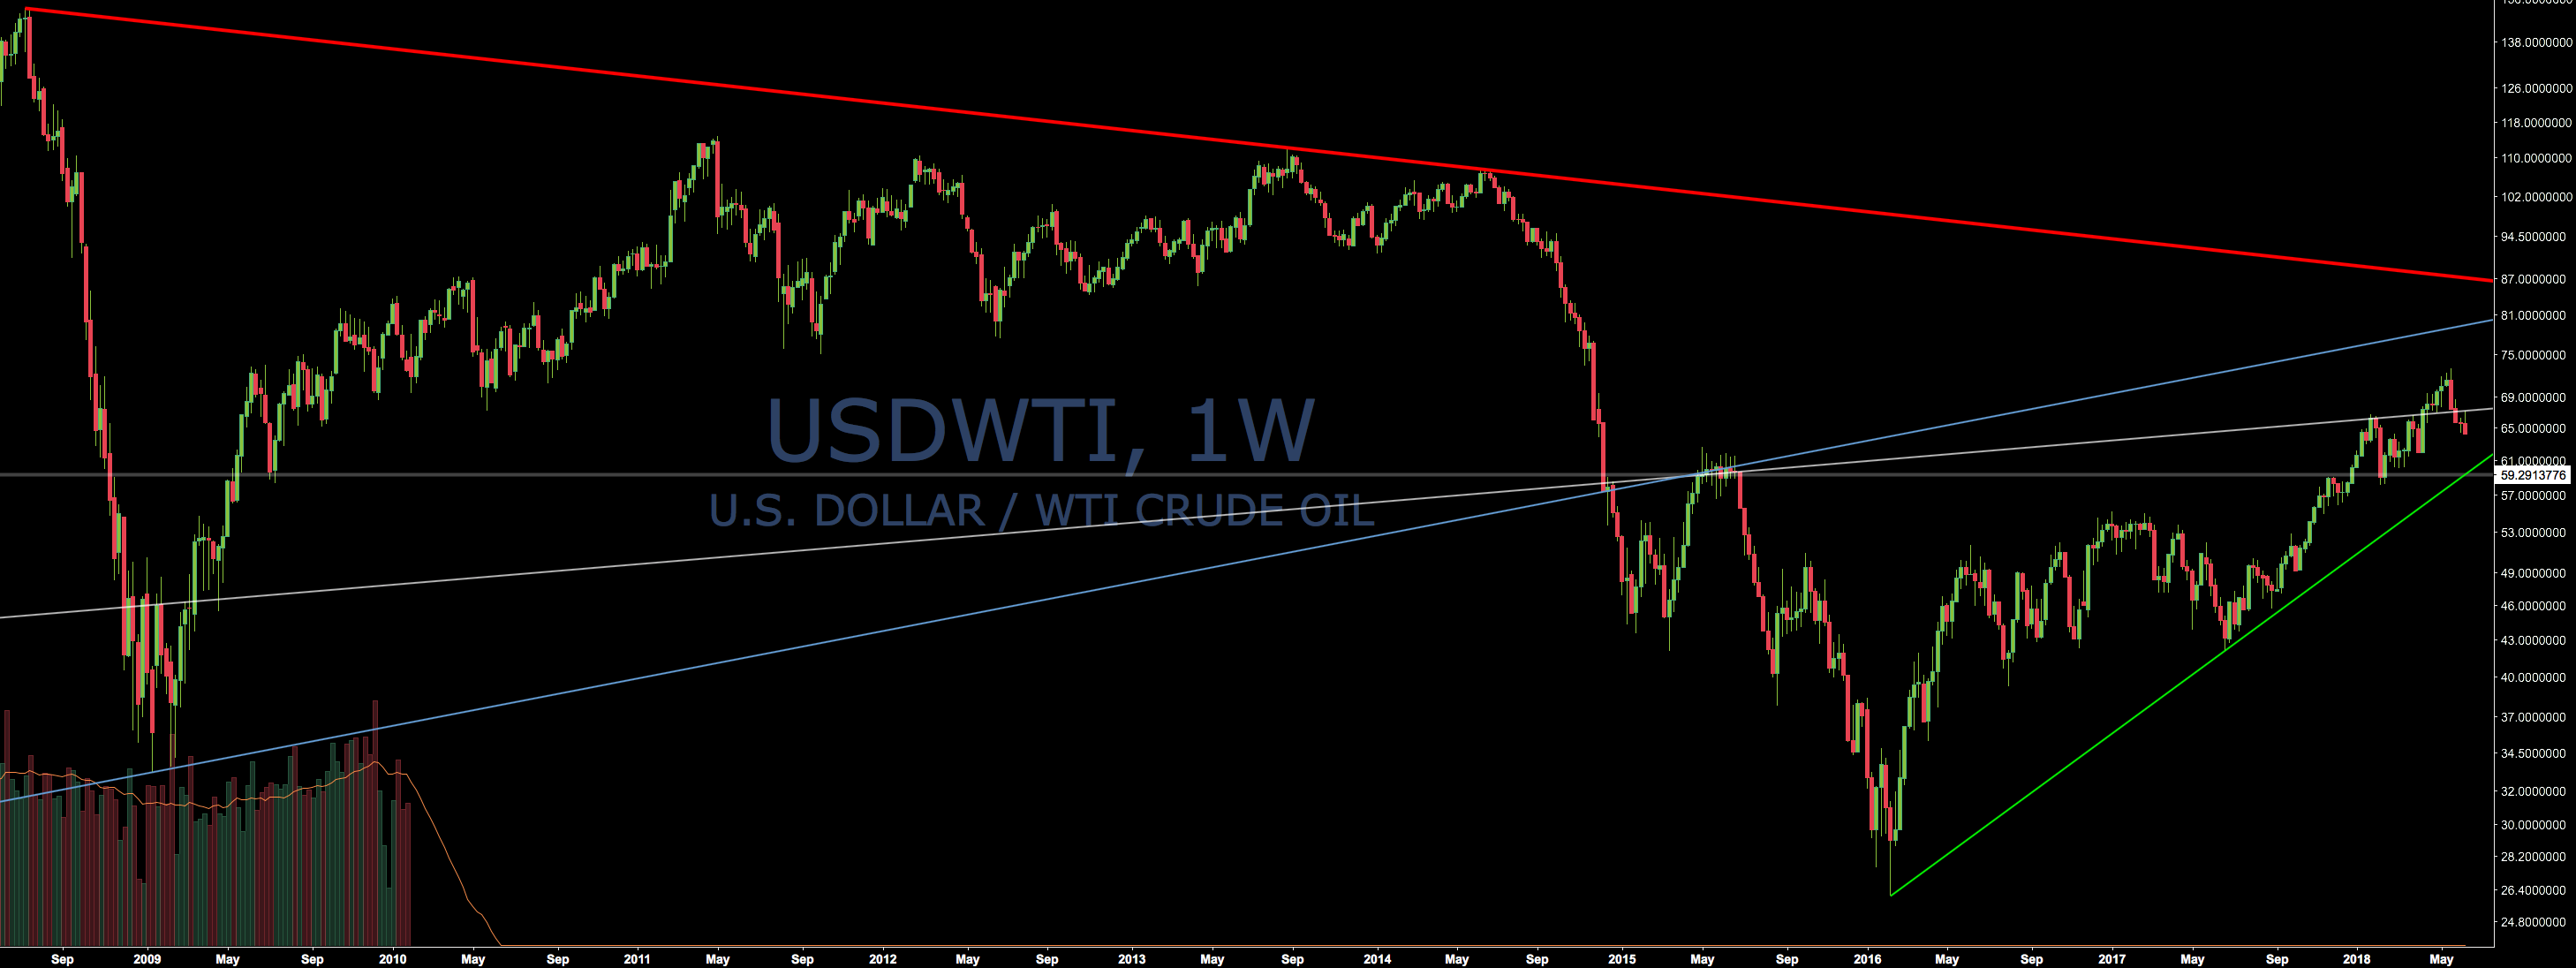
#USDWTI
#EURCAD
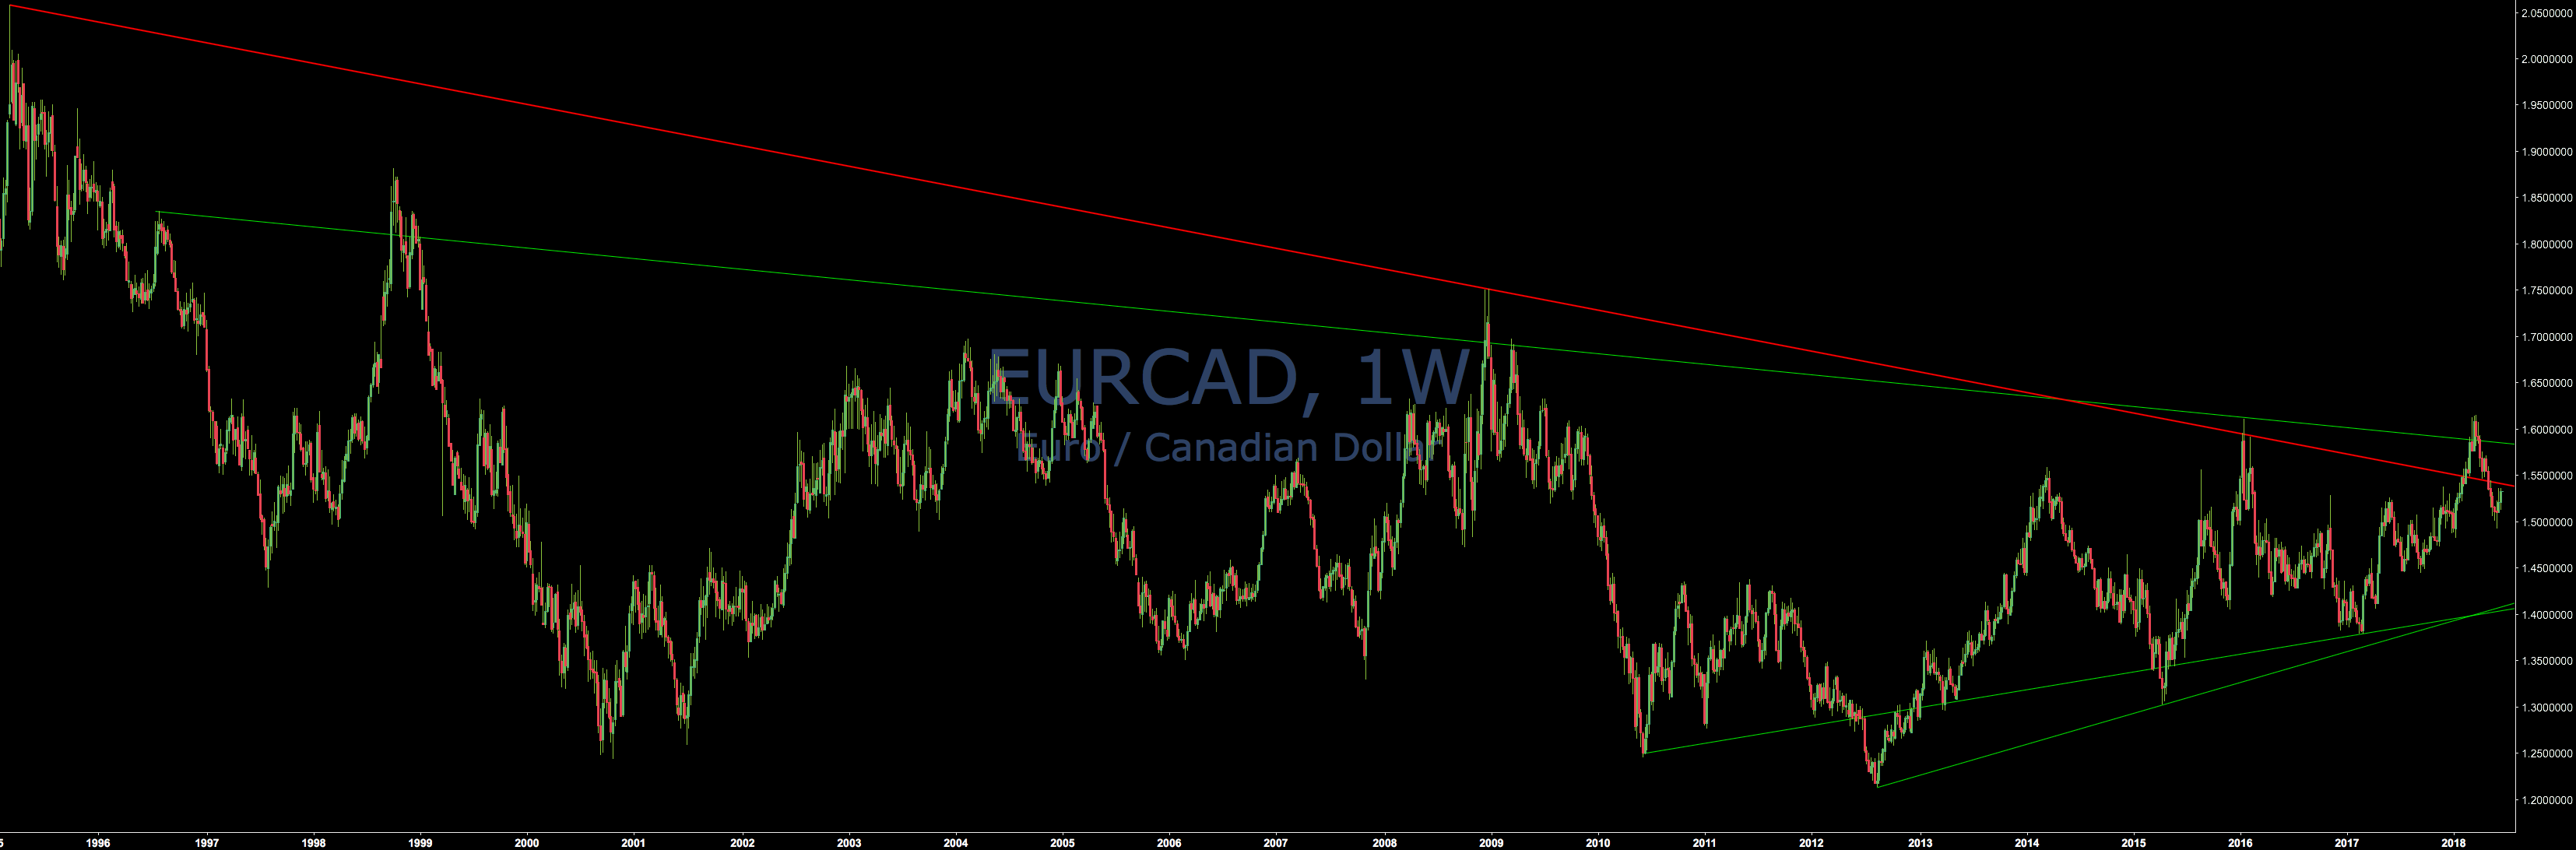
Red trendline looks sellitelně but not nice because of those false breakouts.
#GBPCAD
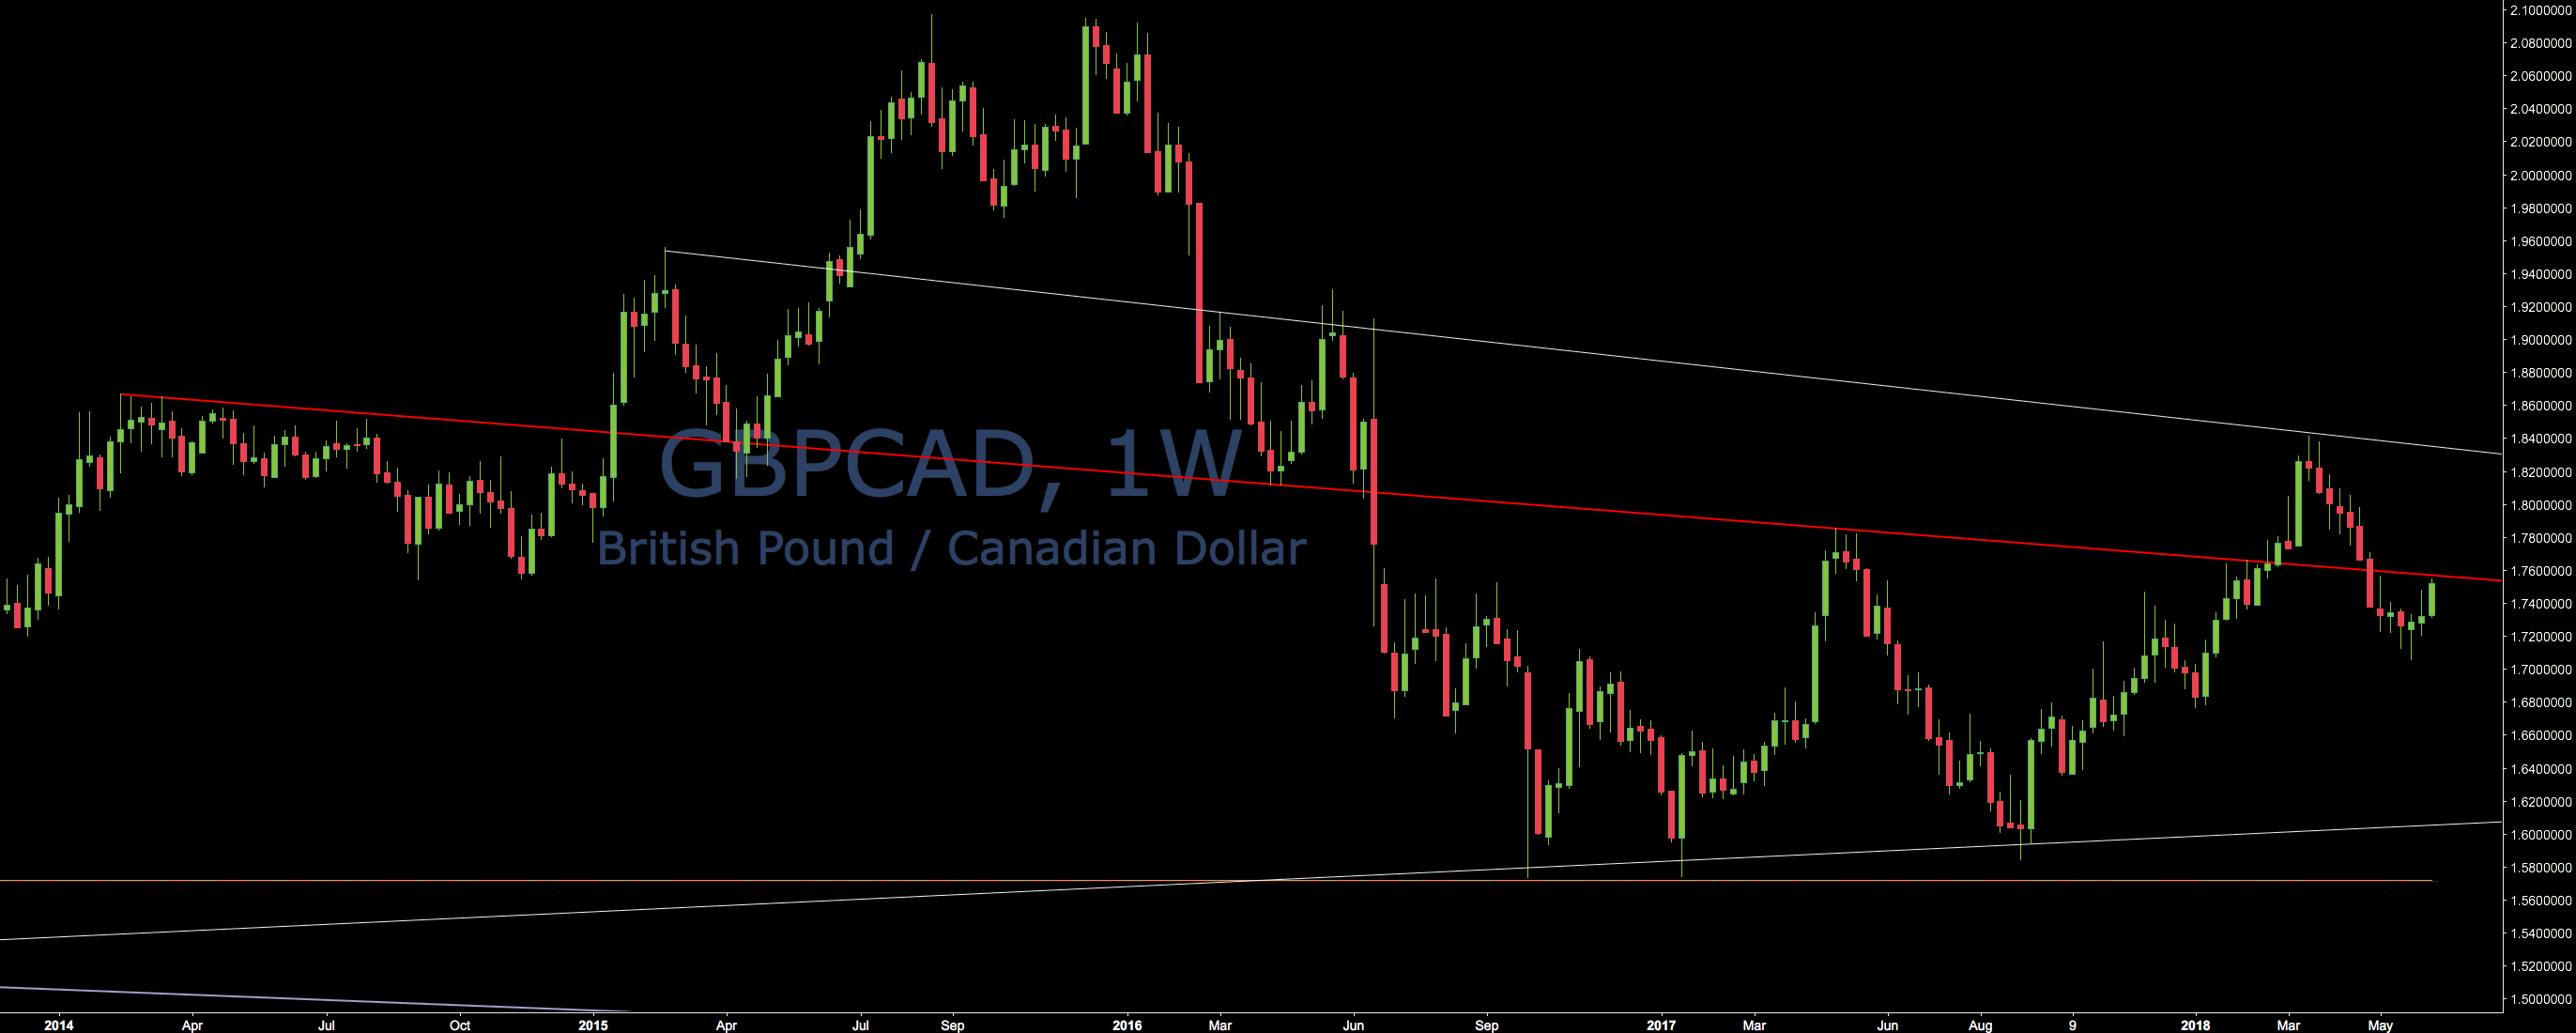
I have already placed a sell-limit for the red trendline.
#GBPHKD
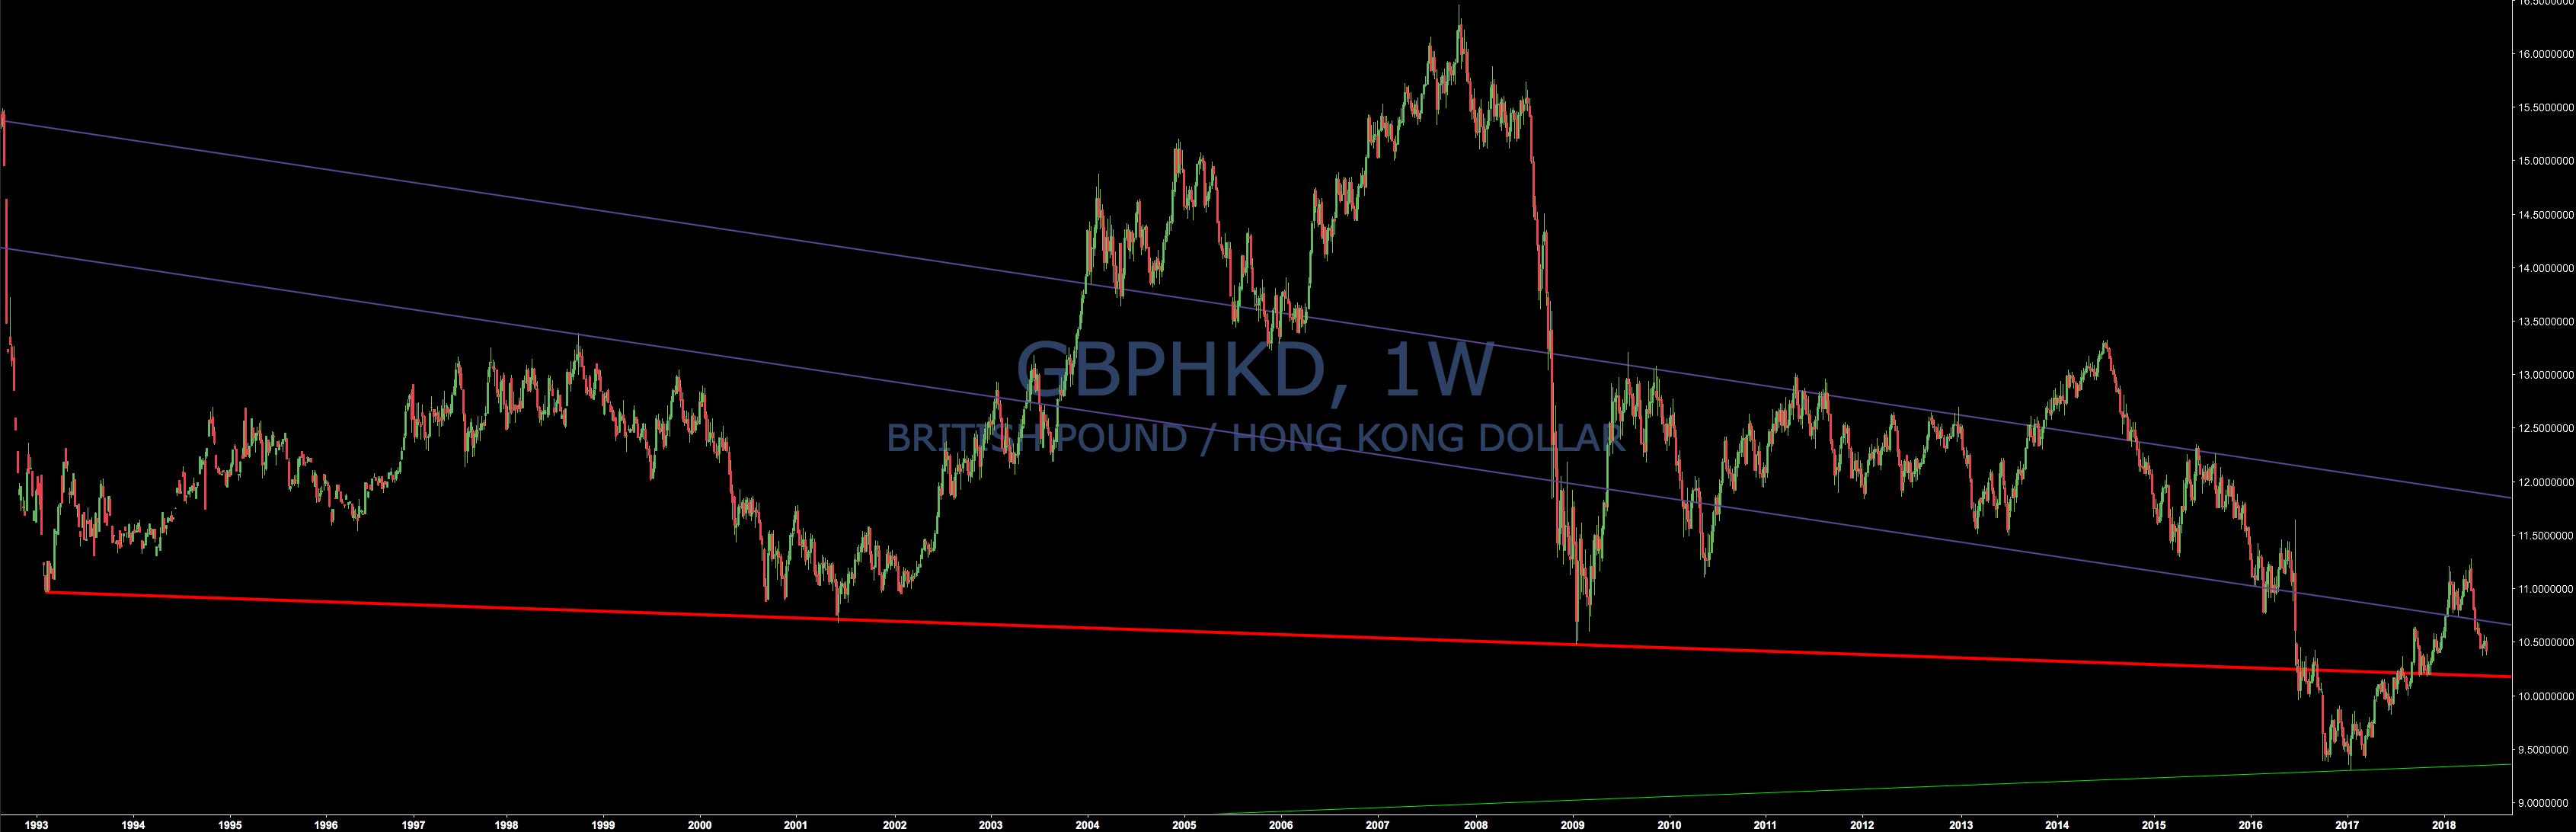
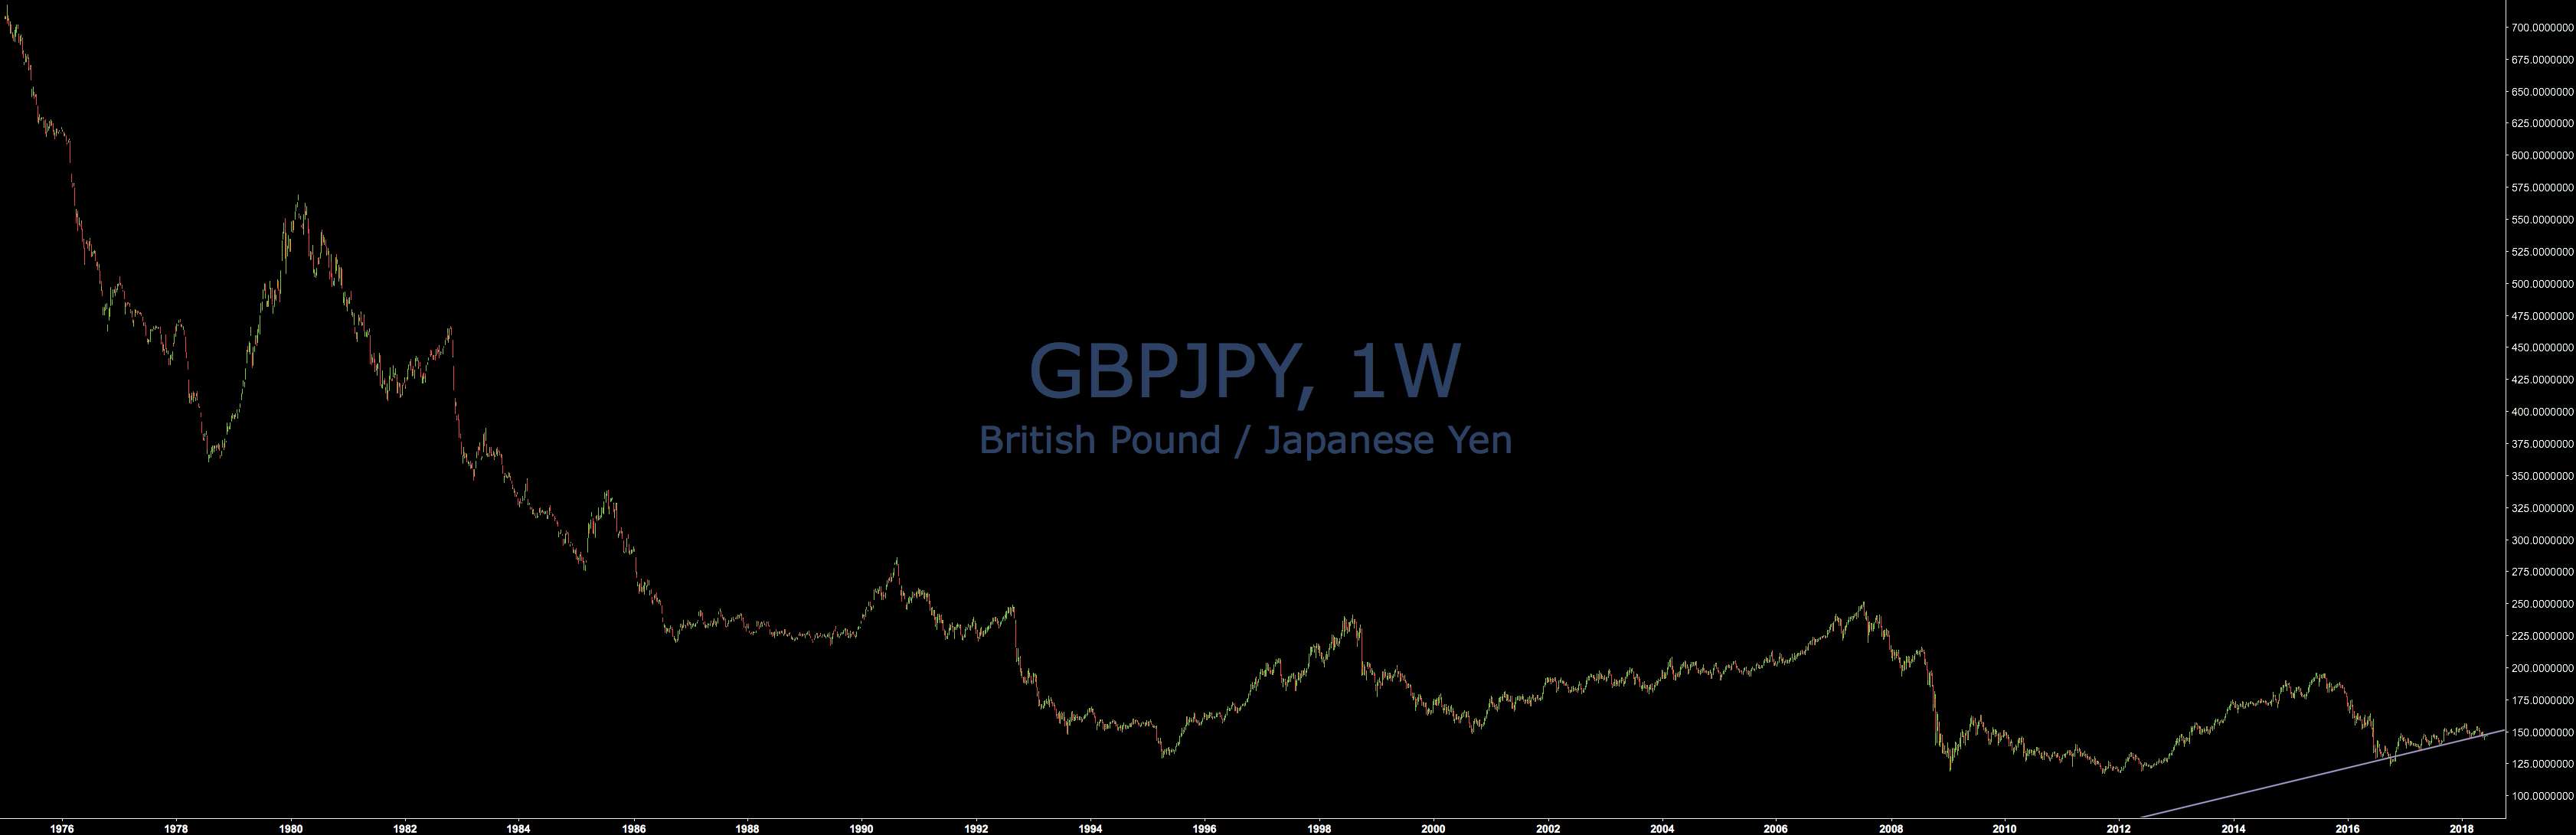
I buy-limited the red trendline. Looks really nice. I think GBP oversold because of this 👇 'U' shaped chart.
#GBPJPY
#GBPUSD

Looks similar to GBPHKD but not so nice.
#GBPZAR

I want to sell stop. But ZAR usually too volatile.
#USDJPY
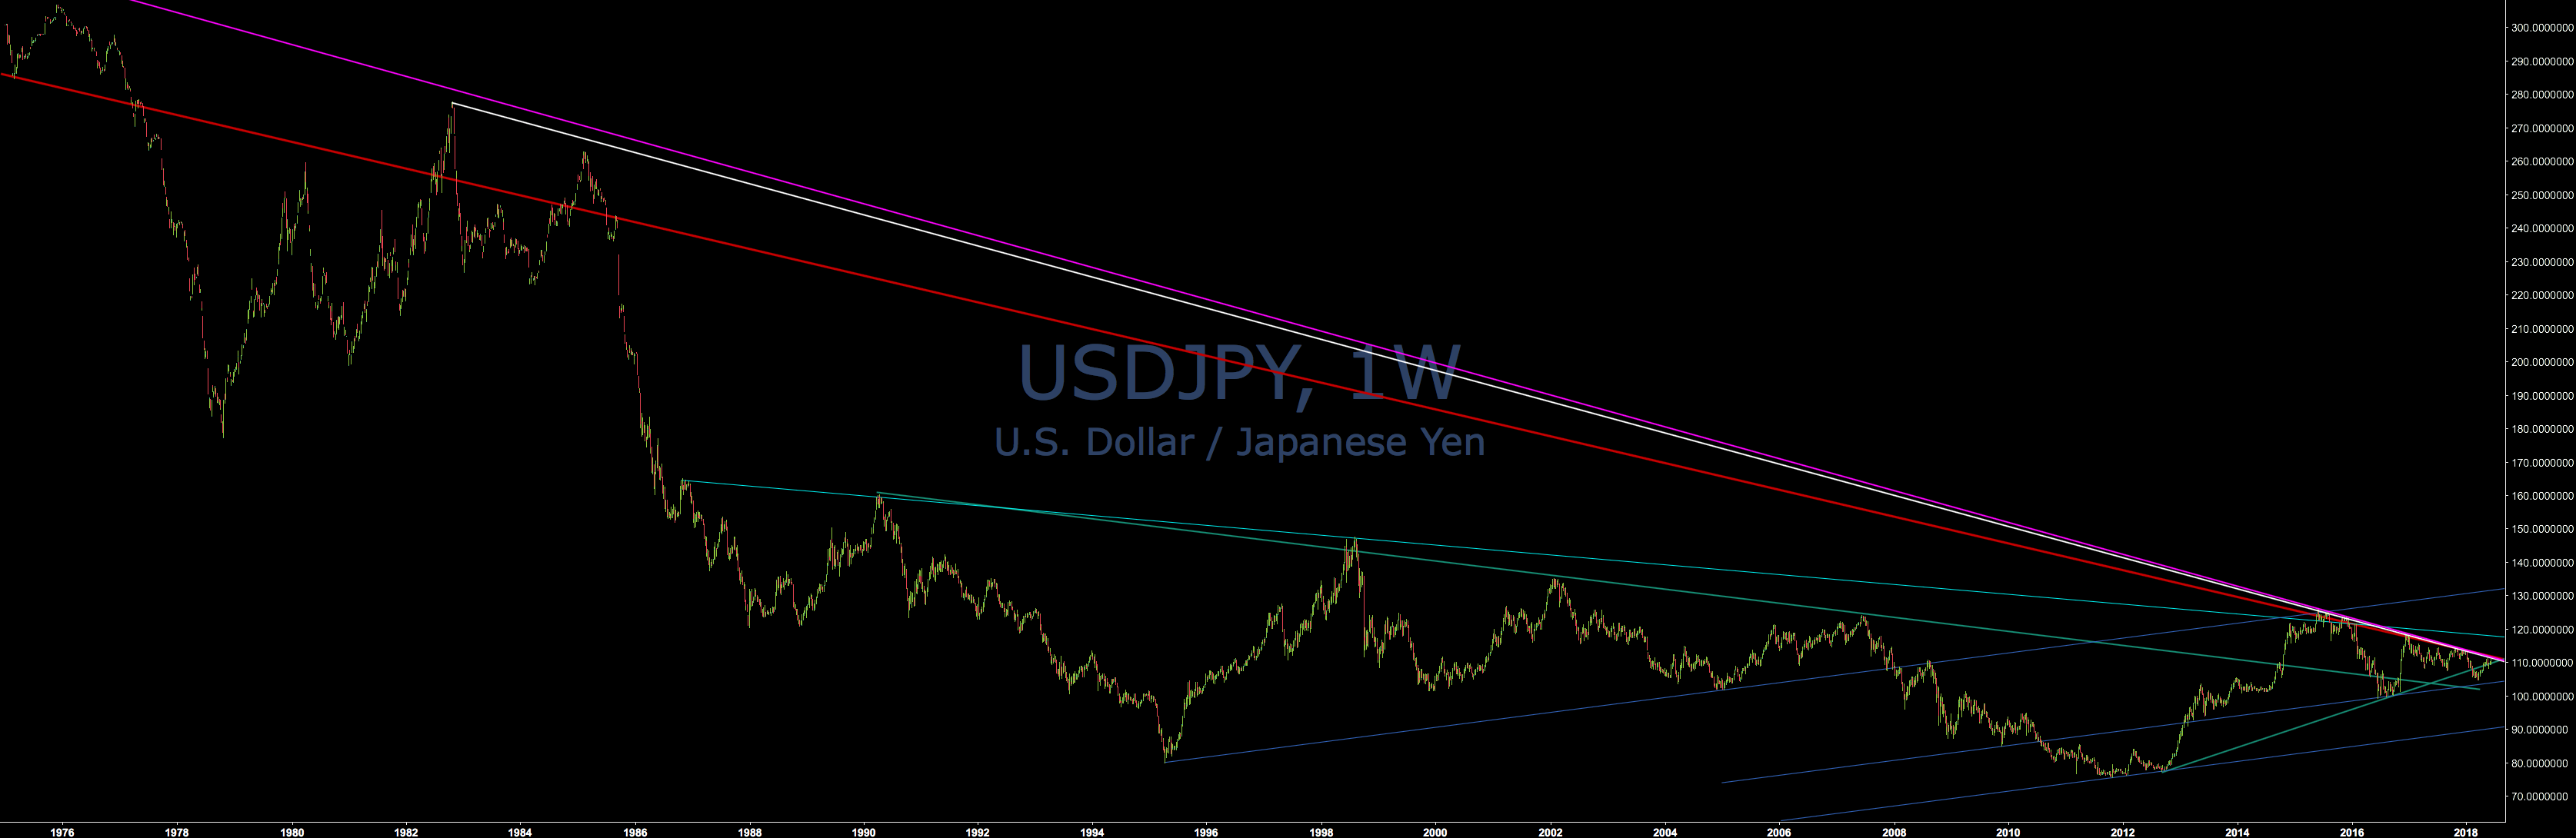
I like this because of this pink trendline from log. scale:

#USDRUB
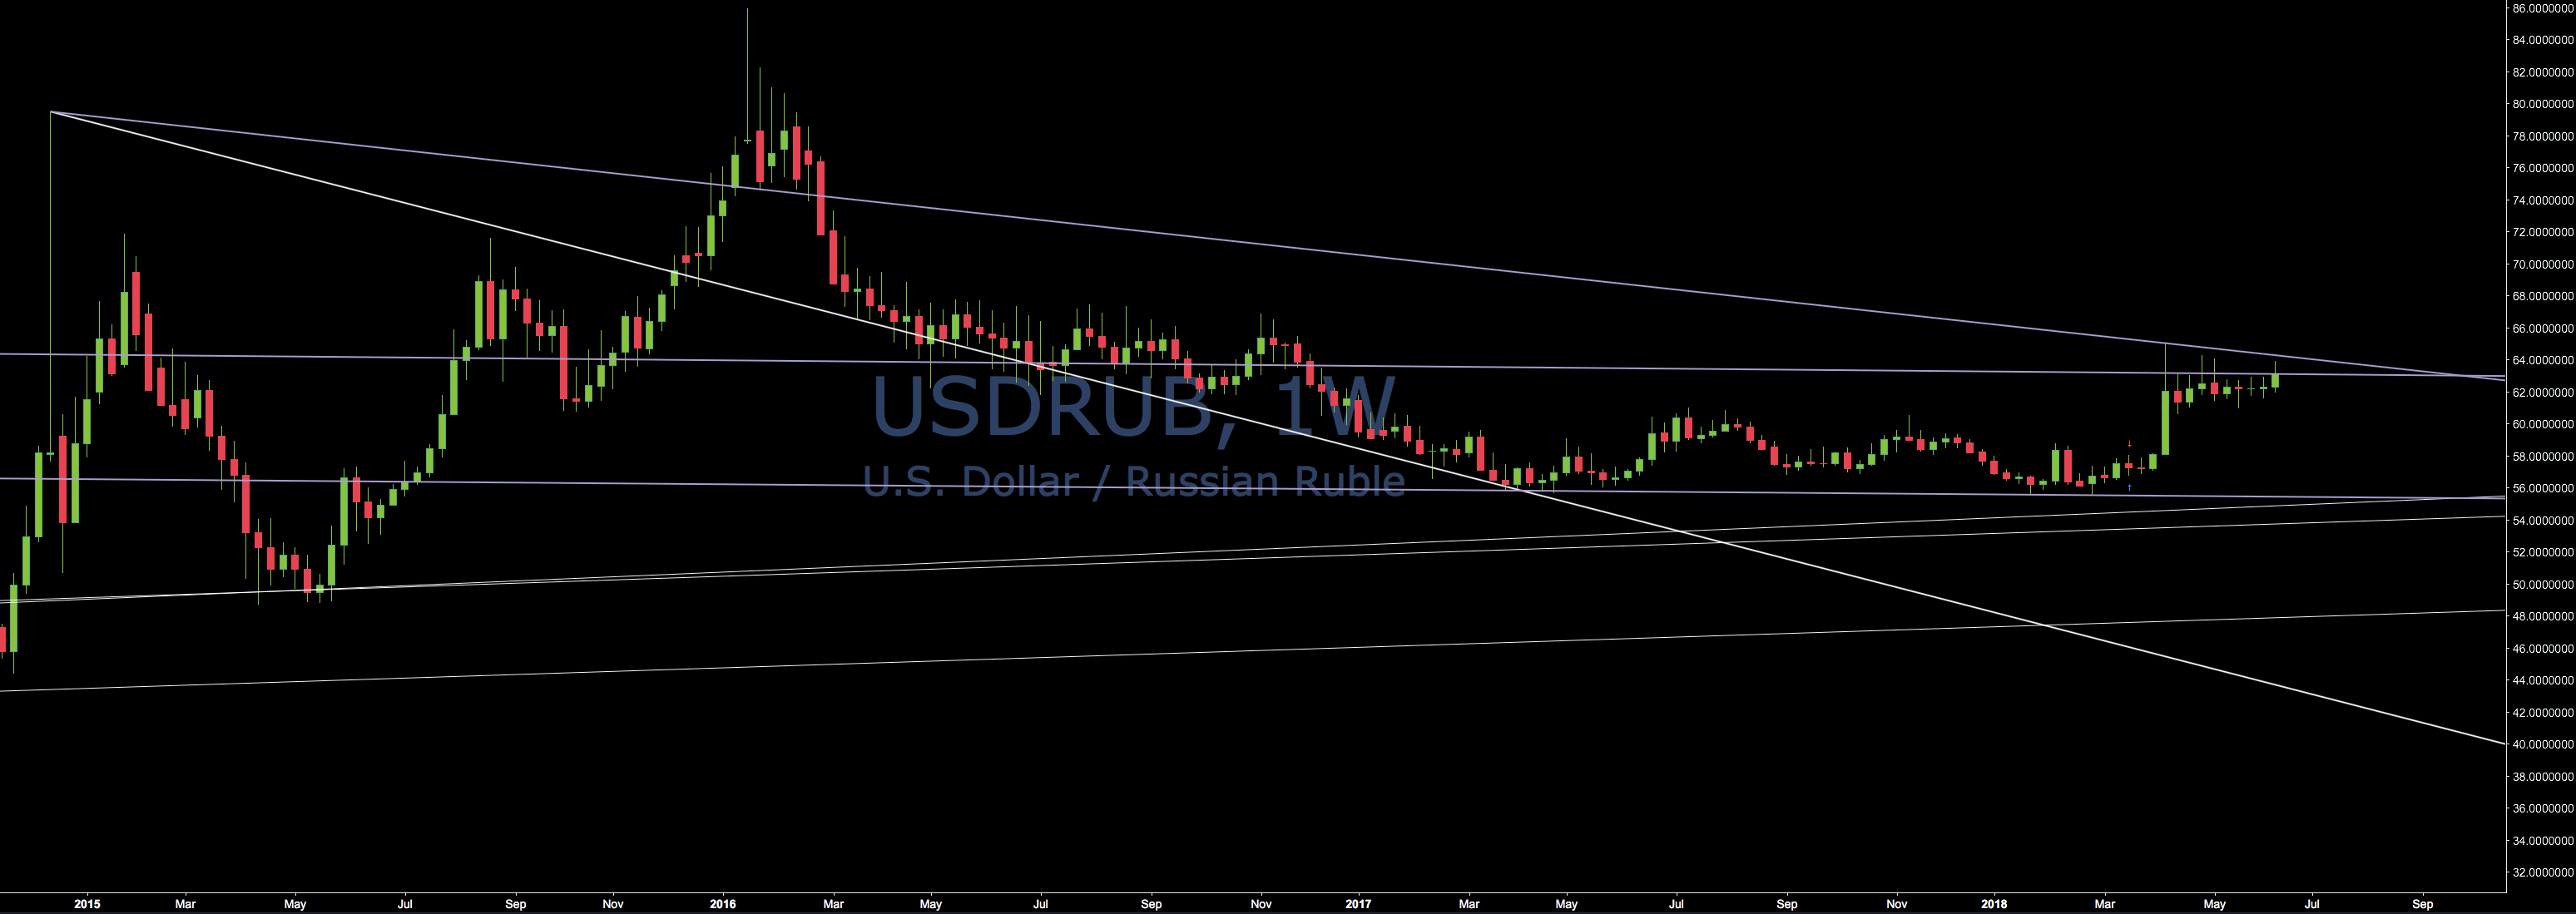
I think USDRUB too high but too volatile too.
#USDZAR
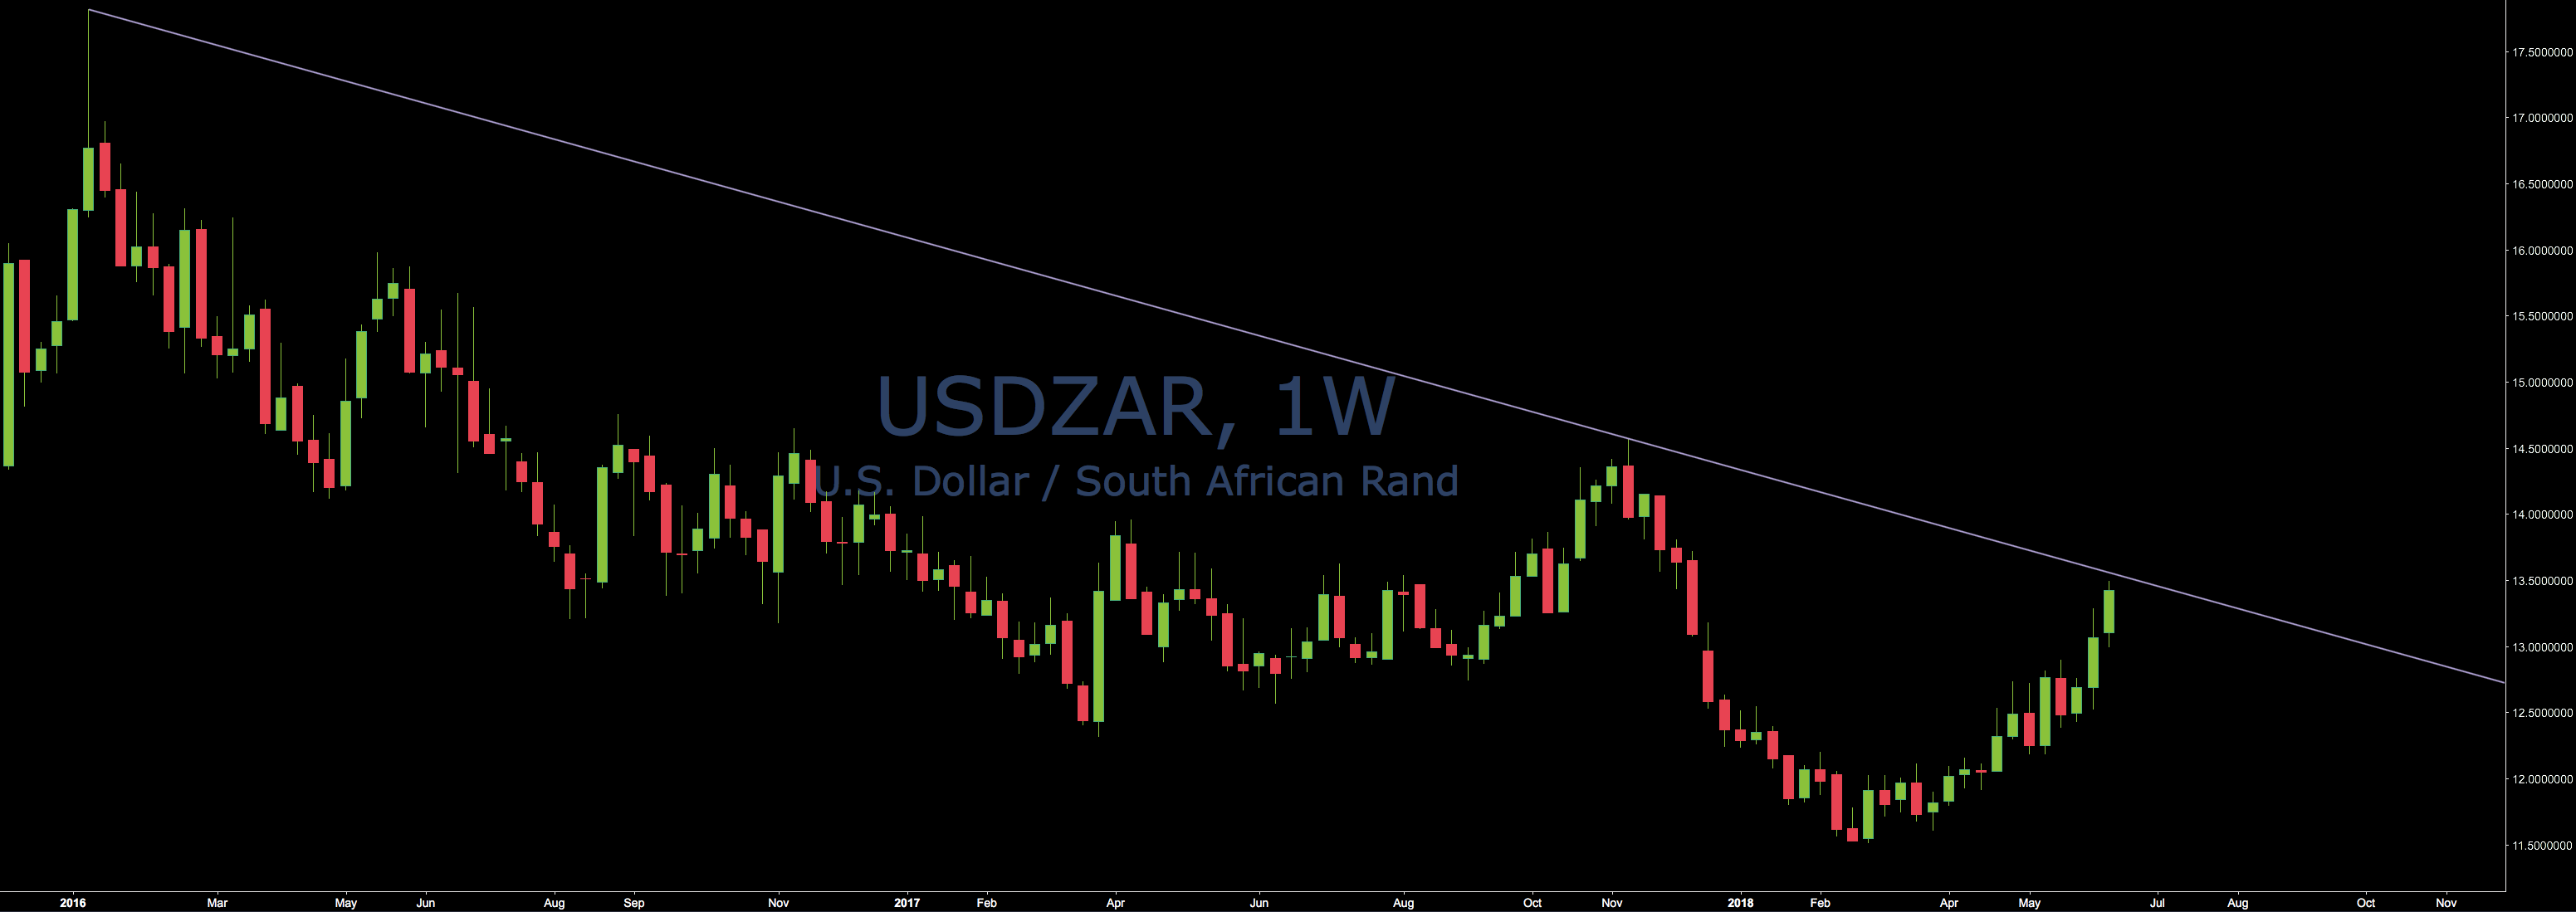
I already placed a sell-limit
#XAGUSD
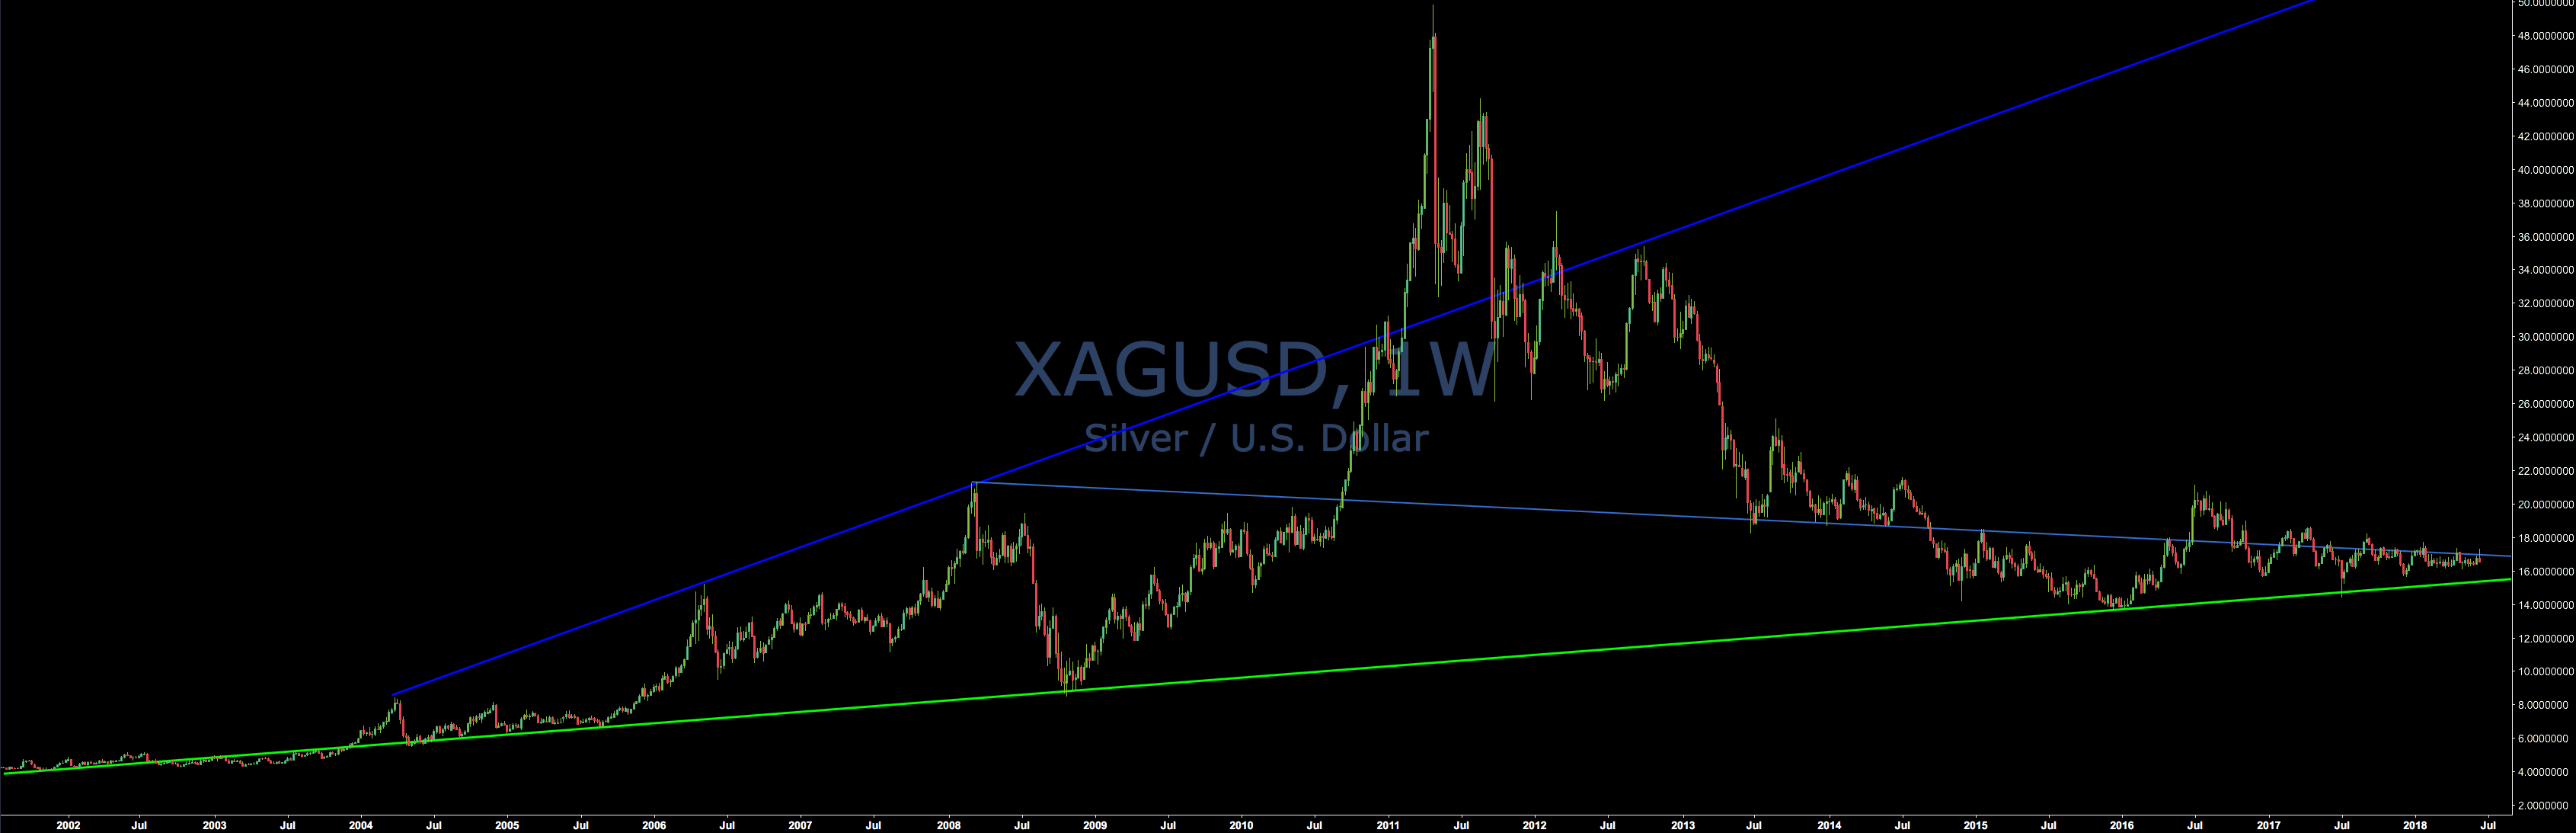
I am going to buy a ton of silver when it approaches the bottom trendline.
Calendar

Thu:


Conclusion
So many trades on GBP can I get some help with choosing the right one in the comment section below?
Risk disclosure: Not a trading advice.
Sources: tradingview.com, systematic thinking
Replies (5)
I notice you aren't confirming your trend lines. Are you checking for volume on your reversals? Are you checking for type 1 or type 2 closes?
Yes I am checking for volume (check out my Instagram where I have one or two posts about how I use volume). But I don't have volume on tradingview's weekly chart that's why it isn't here... But for sure volume is crucial for my decision when to open a position.
What are type 1,2 closes I never heard of that?
Type 1 close is when the candle closes the wick on the trendline. Type 2 close is when the candle body closes on the trendline.
This means that there was a big limit order that got filled. Usually, institutions will set multiple limit orders so you might see a spike in volume (orders being filled) which confirms that there was in fact activity.
Type 3 closes are closes that either break through the wick or body. I don't enter if I see this type of close.
Congratulations @stepanh! You received a personal award!
Happy Birthday! - You are on the Steem blockchain for 1 year!
Click here to view your Board
Congratulations @stepanh! You received a personal award!
You can view your badges on your Steem Board and compare to others on the Steem Ranking
Vote for @Steemitboard as a witness to get one more award and increased upvotes!