

Community post
Nifty Outlook
.jpeg)
The Indian equity market started the week on the expected lines. The market had a gap up start and a much stronger then expected opening in the morning. How ever after stepping into the new week on strong footing, nifty went on a decline trajectory throughout the session.
After falling out of the rising wedge and clinging precariously to current level, there is a high chance of Nifty turning vulnerable at higher levels as it shifts overhead resistance lower.
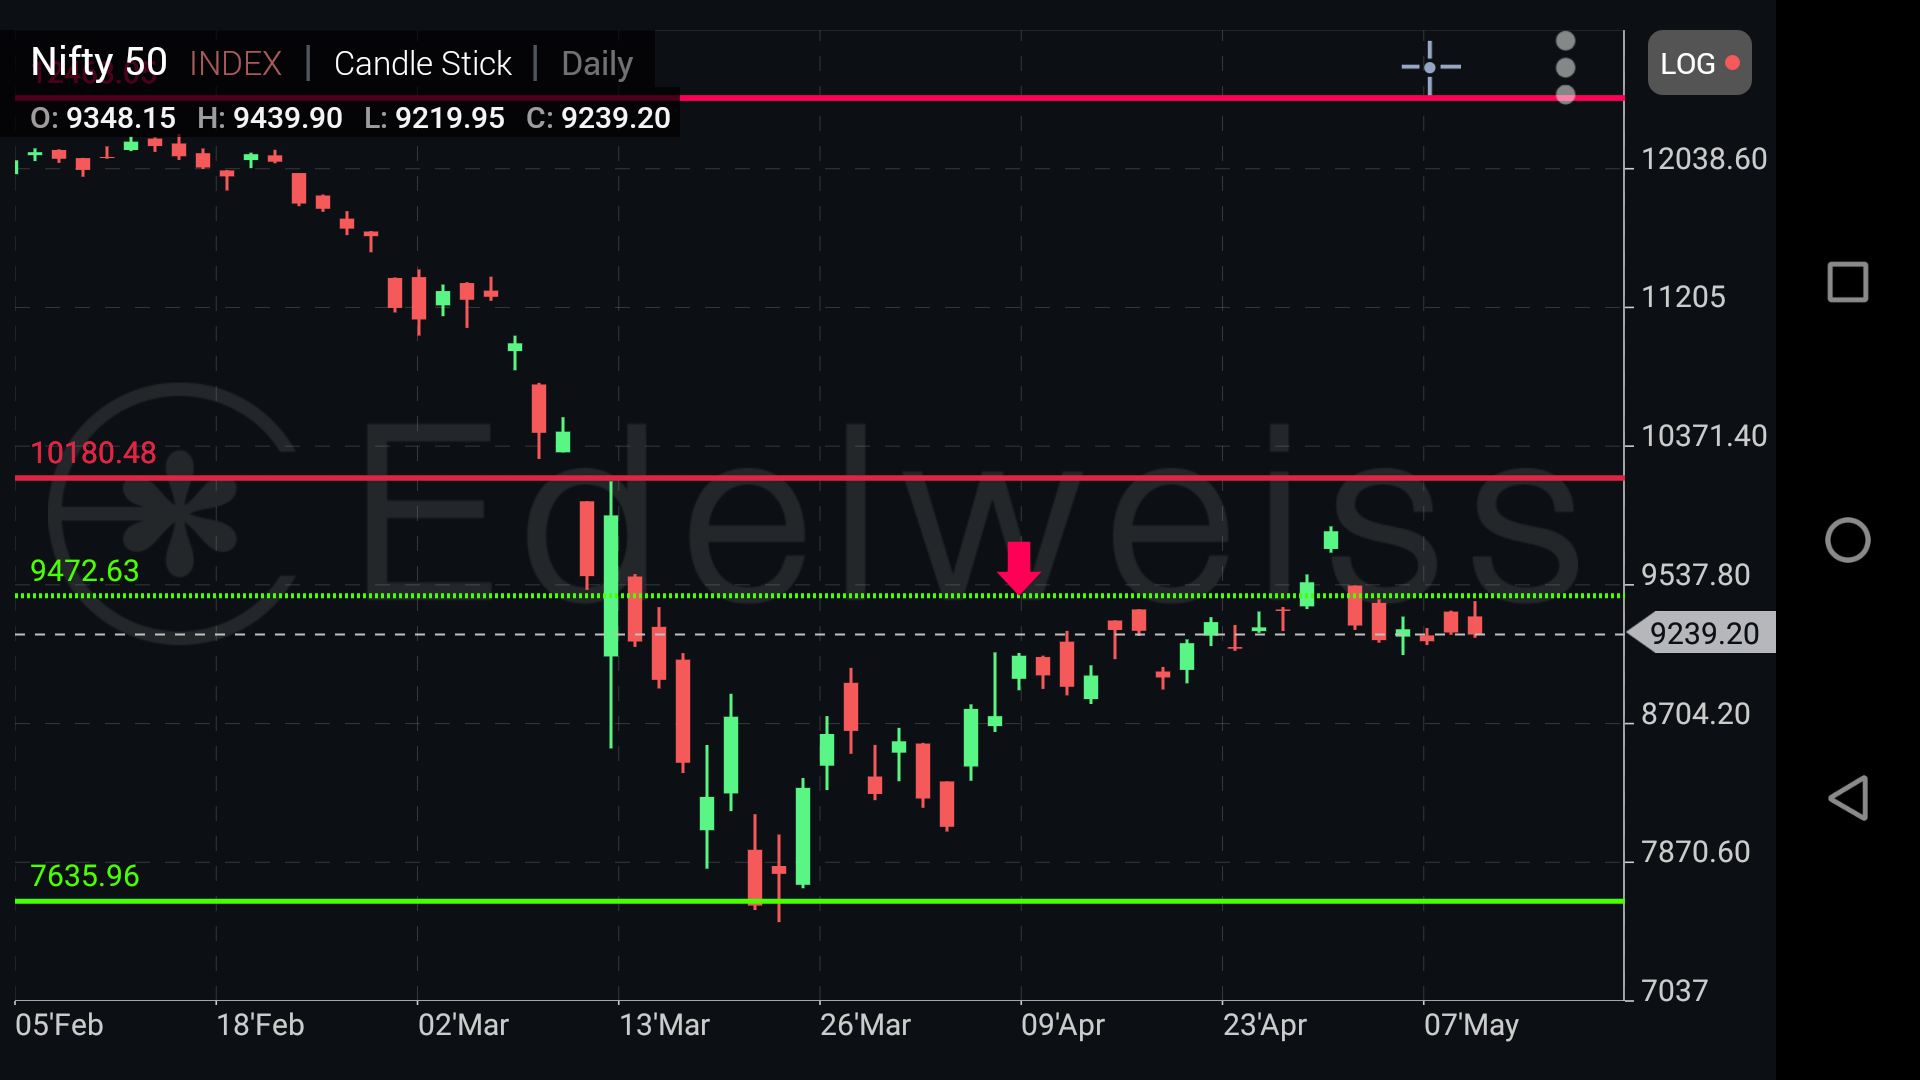
Daily chart of Nifty froms Island reversal pattern. The Relative Strength Index(RSI) on the daily chart stood at 49.13. It remains neutral and does not show any divergence against price. Pattern analysis does not show a comfortable picture of Nifty.
In technical charts, Nifty formed a bearish candle with long upper shadow. Technical indicators signalled weakness. Daily strength indicator RSI continued to remain weak and quoted below the 50 mark, which signals underlying weakness. Momentum indicator Stochastic turned bullish from an oversold zone, indicating that consolidation may continue.
Replies (0)
Conversation
No replies yet
Replies will appear here as people join the conversation.