

Community post
Trend pause for BTCUSD on 20th Dec 2021
TLDR: Time cycle analysis with the initial and final trough marks a pause in the leading trend.
This analysis will be done using Coinbase data, on weekly timeframe and Heikin Ashi Candles.
I would be using the time cycle to see the correlation of past price actions. I made a similar analysis in the previous post here.
Going straight to the chart
https://www.tradingview.com/x/C0I8KNy0/
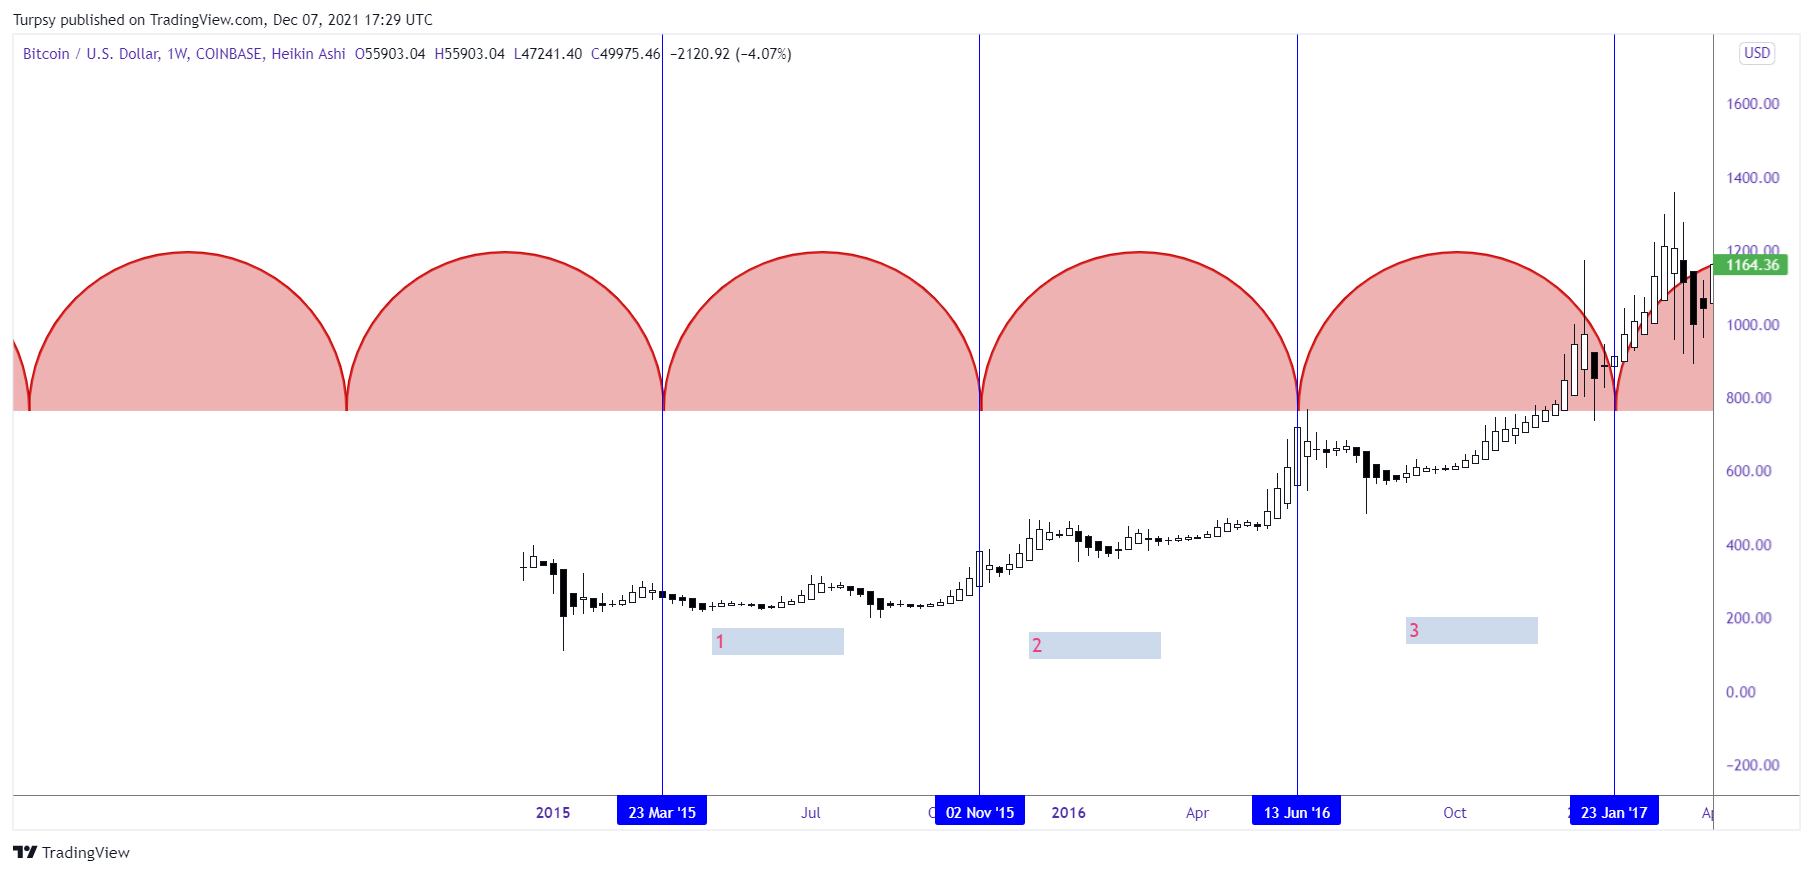
The time cycle considered are from each trough to another trough(marked by blue vertical lines). Also, they are divided into segments and identified by Numbers (1, 2 and 3 ...). It can be seen that the trend from each segment literally takes a pause after each trough, before the continuation of the preceding trend.
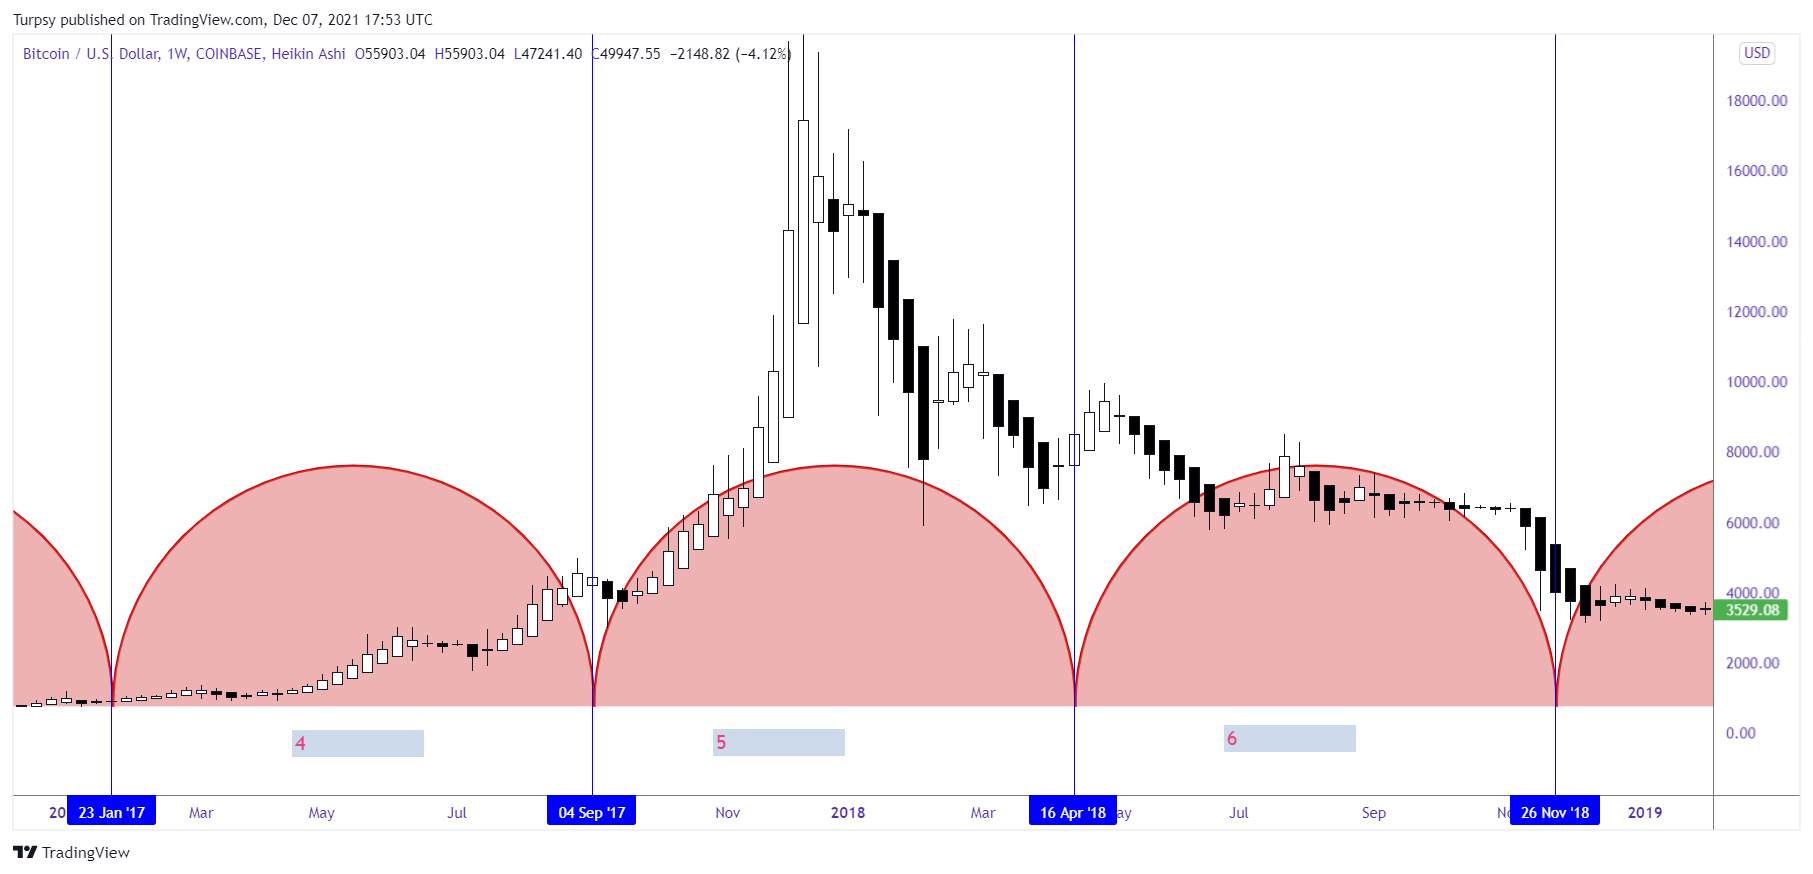
Looking at the next segments (4, 5, and 6 ), after the initial trough of 4 which pauses the trend, the final trough also resulted in the pause of the preceding trend, before the final blow-off in segment 5.
The initial trough of the time series for segment 6, marked a pause of the preceding trends, and thereafter a change of trend, which is not the case in previous segments. The final trough of the time series for segment 6, also, marked a pause in the leading trend. Therafter, the trend changed to another after.
https://www.tradingview.com/x/r1nrdvsz/
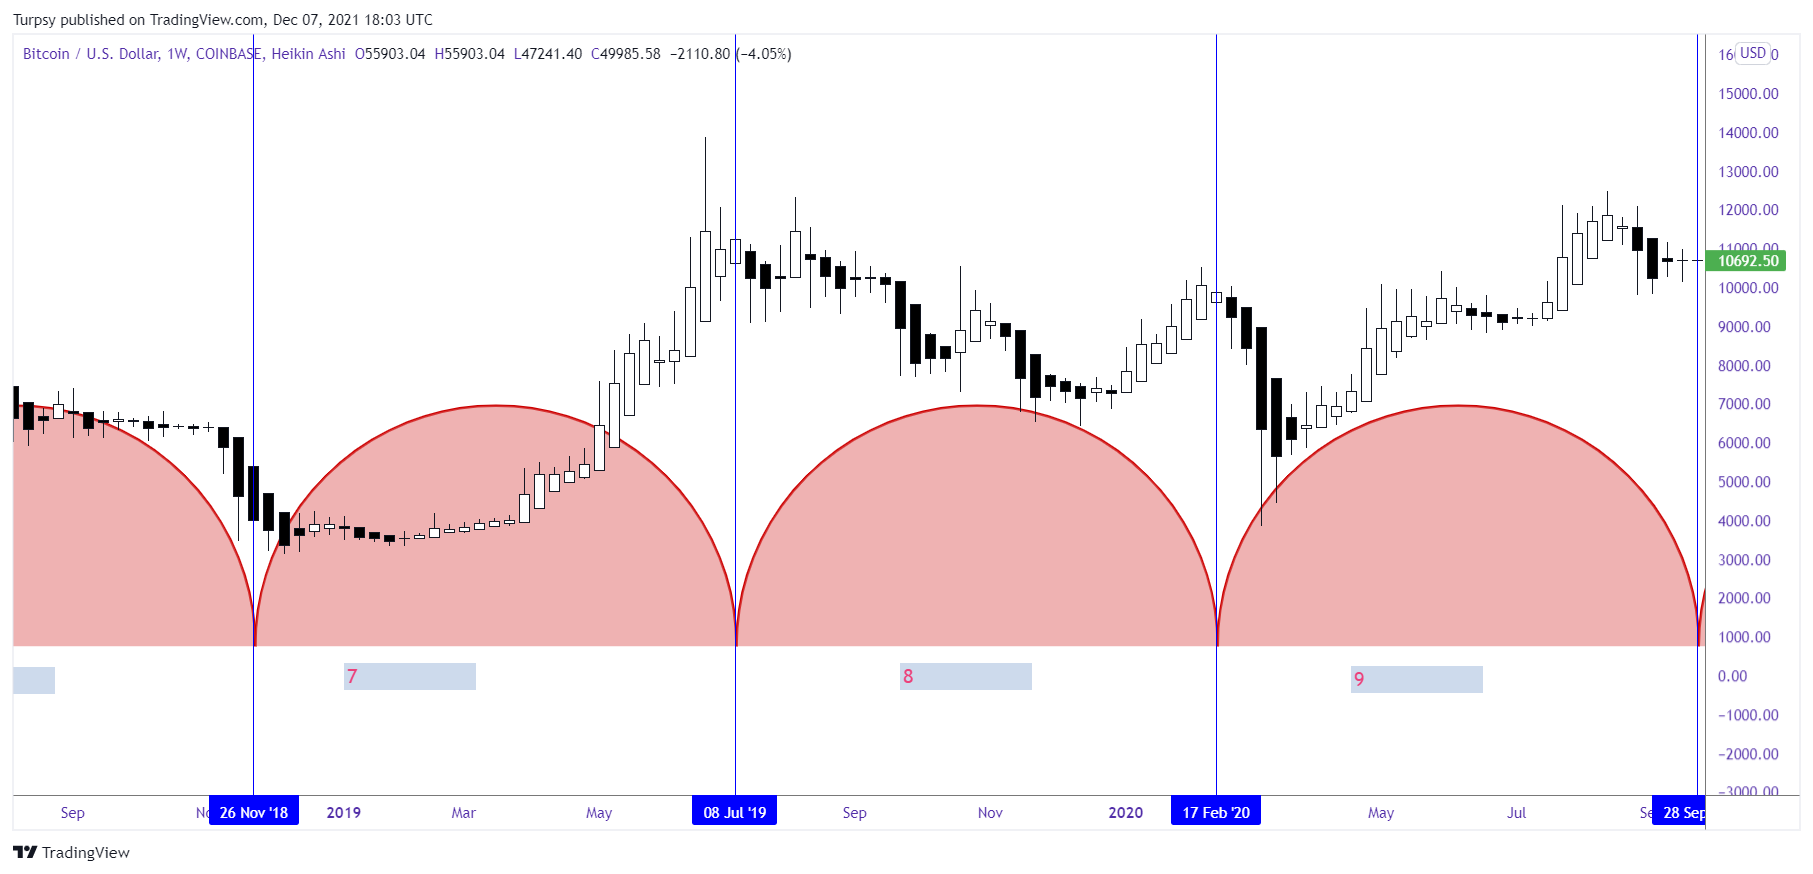
Looking at the final trough of segment 7(initial trough of segment 8), it shows a pause of the preceding trend. The final trough of segment 8, also clearly marked the pause of the brief preceding trend and the beginning of a change in trend. At the final trough 9, the trend clearly paused however, we had a continuation of the major trend.
https://www.tradingview.com/x/NGfOtn6A/
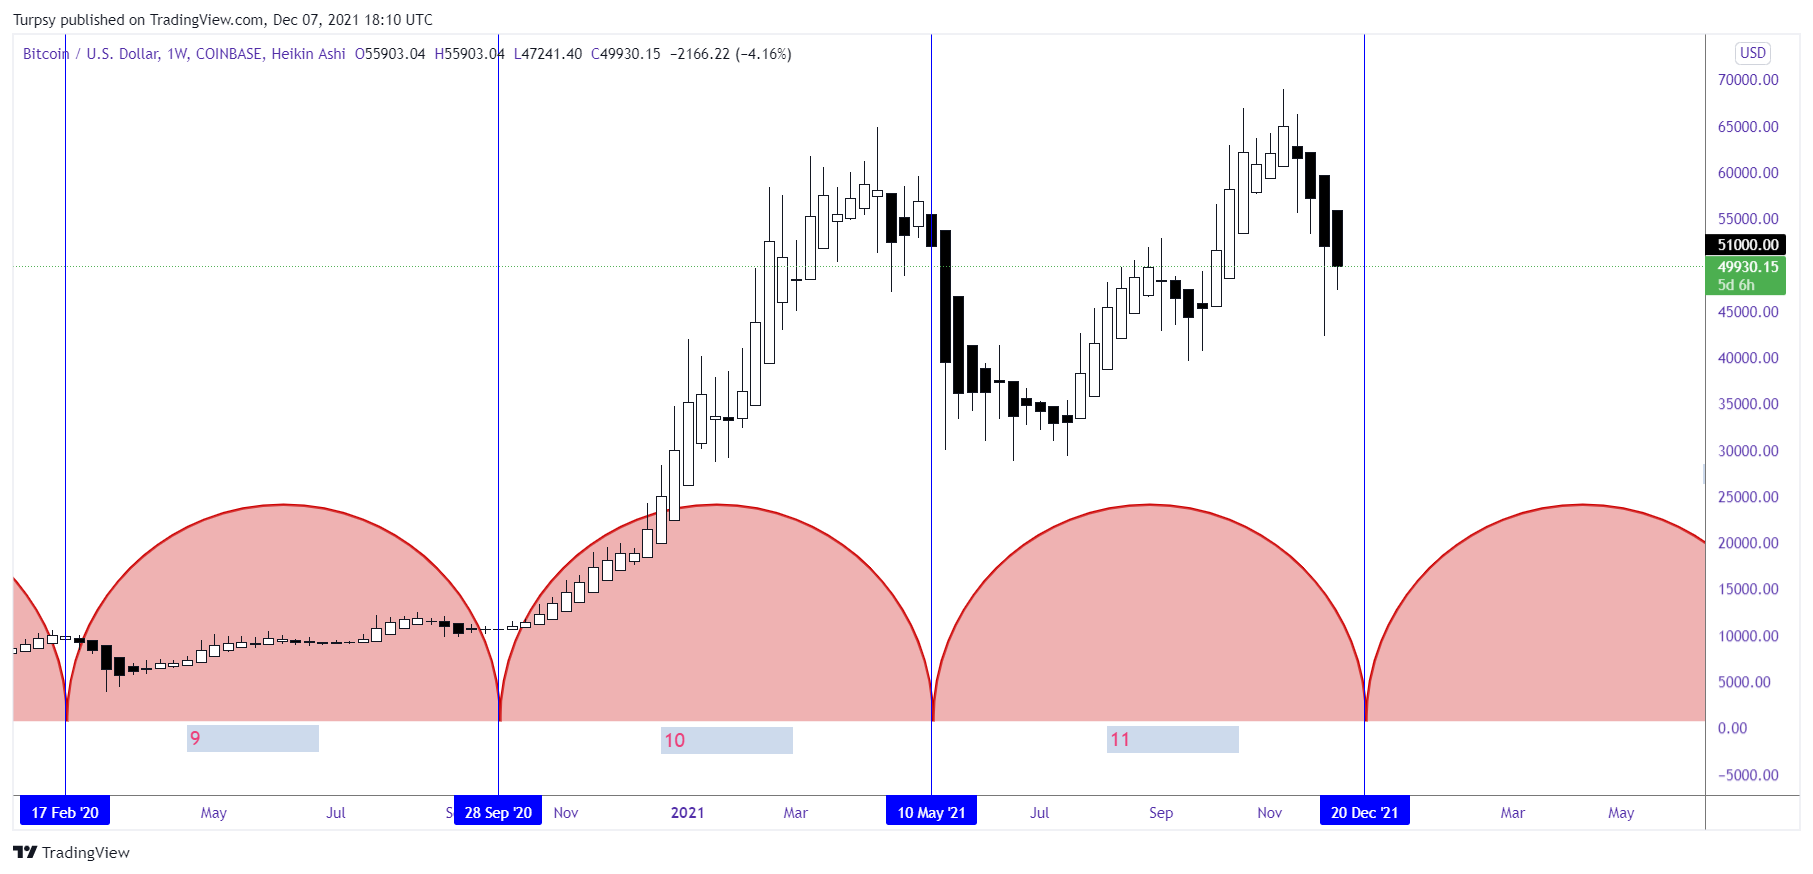
Segment 10 also had a pause and reversal of the major trend at the end of the trough. Right now, the final trough of segment 11 will come on the 20th December, 2021, this could give a pause of the leading trend and then we may see a reversal or continuation of the major trend.
https://www.tradingview.com/x/cMPiYJrK/
Summary based on past price actions
| Final trough | Observations | Date |
|---|---|---|
| 1 | Paused after Final trough and continuation of mark-up trend | 02 Nov 2015 |
| 2 | Paused after Final trough and continuation of mark-up trend | 13 June 2016 |
| 3 | Paused before Final trough and continuation of mark-up trend | 23 Jan 2017 |
| 4 | Paused after Final trough and continuation of mark-up trend | 4 Sept 2017 |
| 5 | Paused before Final trough and brief mark-up trend | 16 April 2018 |
| 6 | Paused after Final trough and discontinuation of mark-down trend | 26 Nov 2018 |
| 7 | Paused before Final trough and discontinuation of mark-up trend | 8 July 2019 |
| 8 | Paused after Final trough and brief mark-down trend | 17 Feb 2020 |
| 9 | Paused before Final trough and continuation of mark-up trend | 28 Sept 2020 |
| 10 | Paused before Final trough and discontinuation of mark-up trend | 10 May 2021 |
| 11 | - | 20 Dec 2021 |
| column1 | column2 | column3 |
Take home:
Generally, it can be seen that each trough (initial or final) marks a Pause of the preceding trend, thereafter we can see a continuation or discontinuation of the trend.
We can use this information to our advantage by taking a pause trading to see what happens at the final trough/initial trough, before taking a position in the market: either to short or long.
I saw this in April, however, I wasn't confident on this time series analysis. If I had exited the market at the final trough. I would have had a good head-save during the dump.
With this analysis posted, I can follow this analysis and see if it holds water.
It is important to know that this is just informational, no certainty and it is written to give an idea and opportunity for people to do more probabilistic studies.
Posted Using LeoFinance Beta
Replies (2)
Really hope this time-cycle works. However, whatever happens, I will update in another post.
Congratulations @turpsy! You have completed the following achievement on the Hive blockchain and have been rewarded with new badge(s):
Your next target is to reach 16000 upvotes.
You can view your badges on your board and compare yourself to others in the Ranking
If you no longer want to receive notifications, reply to this comment with the word
STOPCheck out the last post from @hivebuzz:
Support the HiveBuzz project. Vote for our proposal!