

Community post
Trying to label Elliott wave ii

The wave ii correction started a bit slow, but has been picking up steem lately.
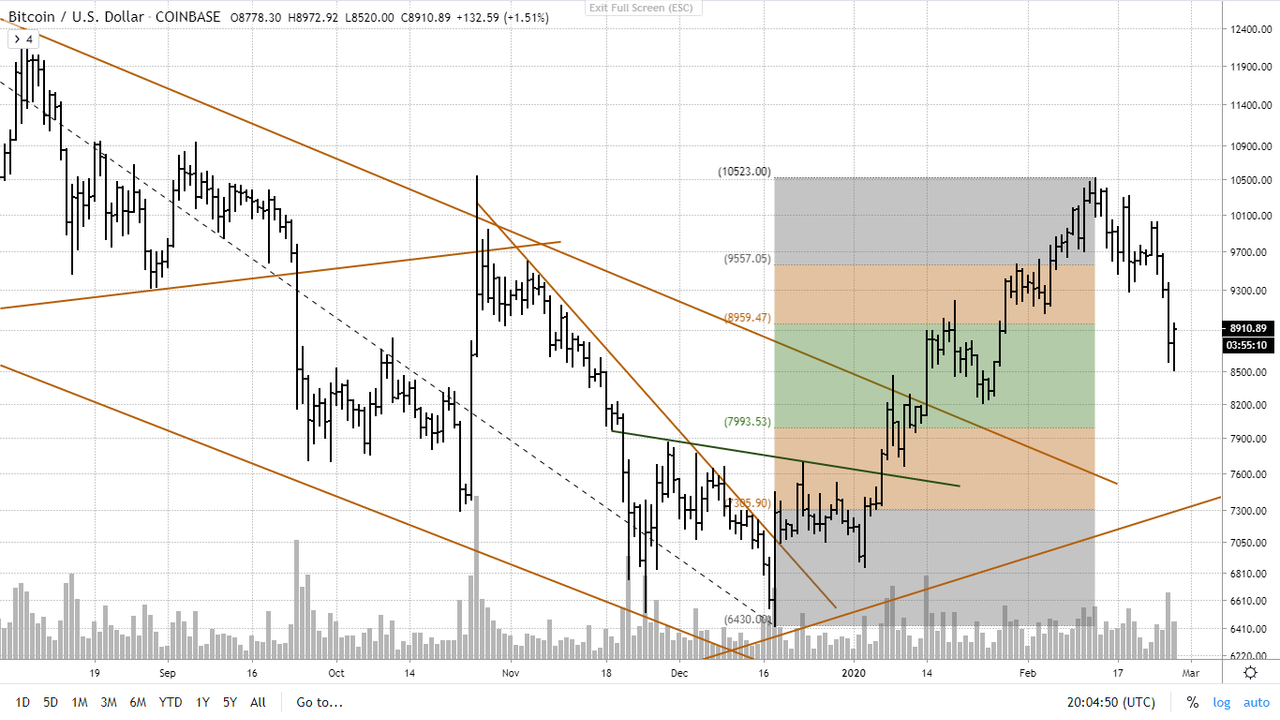
On Bitfinex, today, we printed a low of $8555; which is already in our Fibonacci target area, which means it could be over already.
Of course, there are other variations imaginable for this correction. For instance, like below:
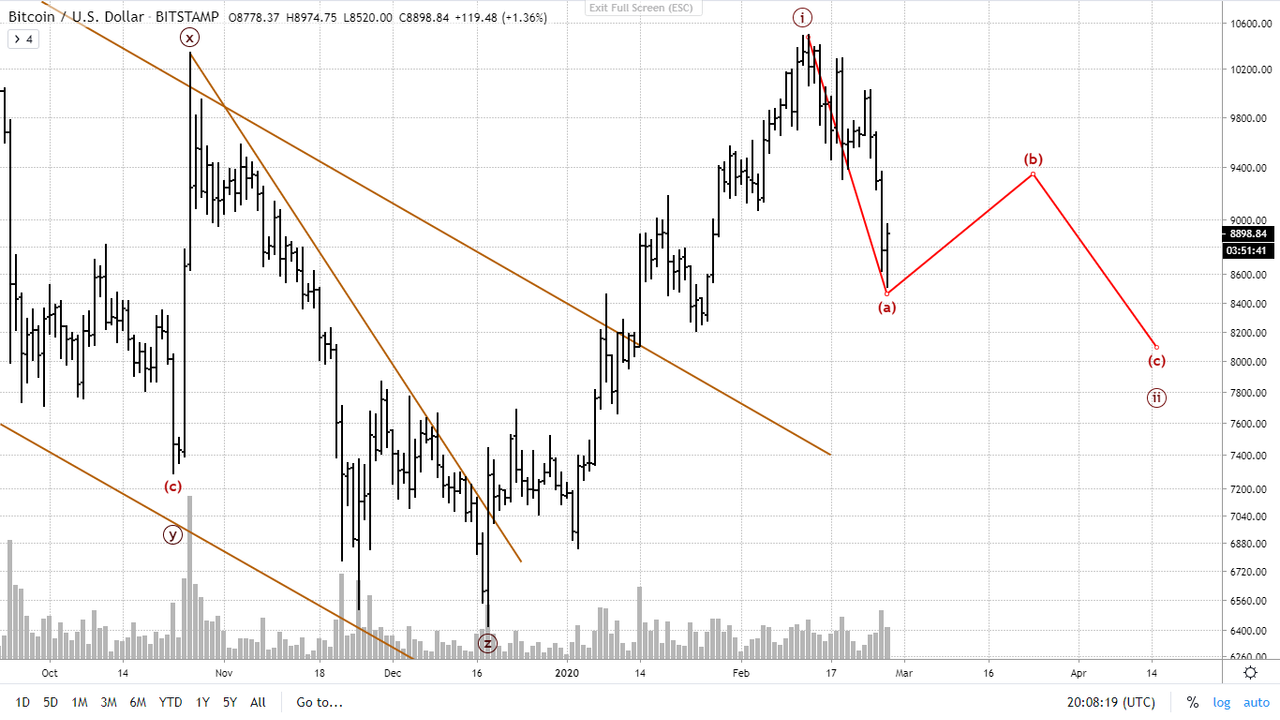
Not unimportant is the fact that the daily stochastics are totally oversold.

Consequently, something of countermove, at least a correction, is to be expected.

However, the MACD's are nowhere near diverging which suggest another move down after this correction upwards, within wave ii down.

This leads me to prefer above variation.
EOD data, or in this case: end of 3 hour data, gives clearer Elliott patterns, making the count a bit easier.
Weekly and daily chart given below to clarify this statement.
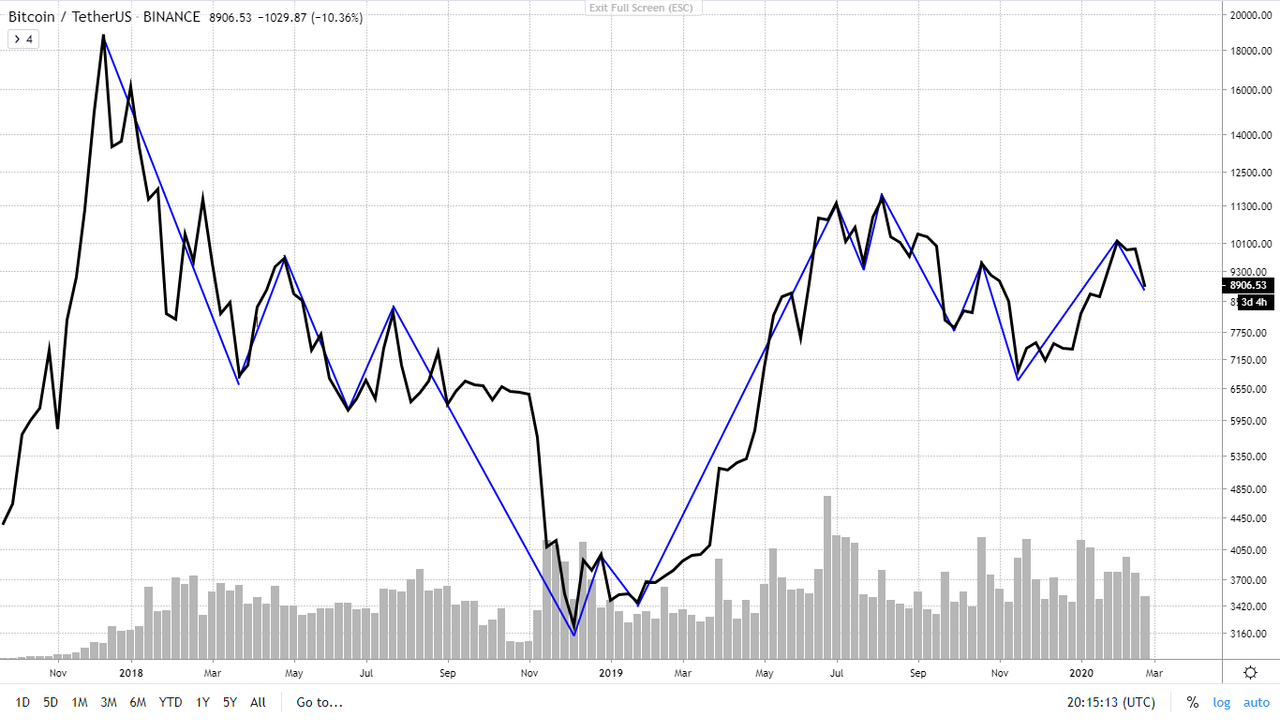

We'll see how it turns out. I've sold my put for a small profit and will just keep increasing my futures position by dollar cost averaging as I still see us in an uptrend until summer 2021. Whether we go down a bit more or not is of little consequence.
Replies (2)
Gute Analyse, bin gespannt wie es sich weiter entwickelt.
Ich aber auch