

Community post
Wave ii bottom in sight

We are approaching the weekly parabolic support line which leads to over 100k in September 2021.
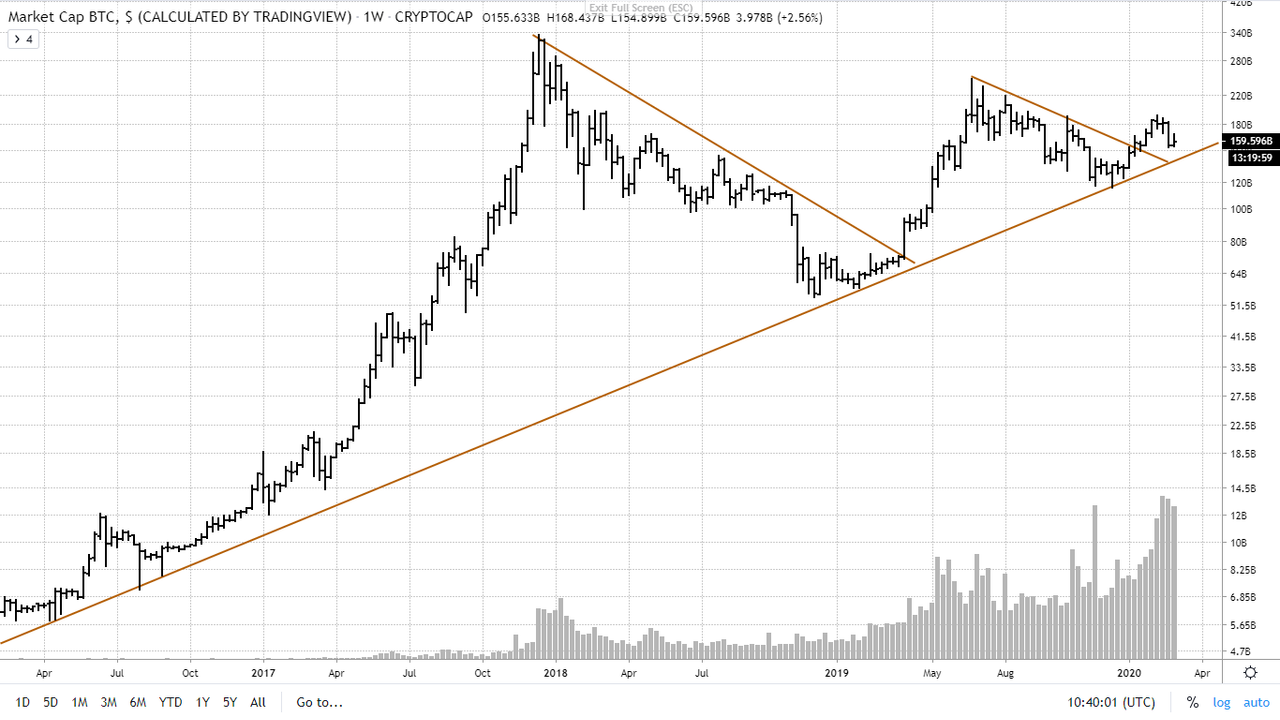
Also, the bitcoin market cap chart is approaching its weekly support line.

And the weekly On Balance Volume indicator is at support.

So, the assumption from last week, that we're in a c-wave impuls, may still hold and will lead to a target of approximately $8300.

At $8k we have the 61.8% Fibonacci retracement level.

The Renko chart is still looking good. Yes, there are a couple of red bricks for this correction, but the Ergodic indicator is still bullish.

If we make a new low at 8k and a bit, there will be a textbook divergence on the MACD's.
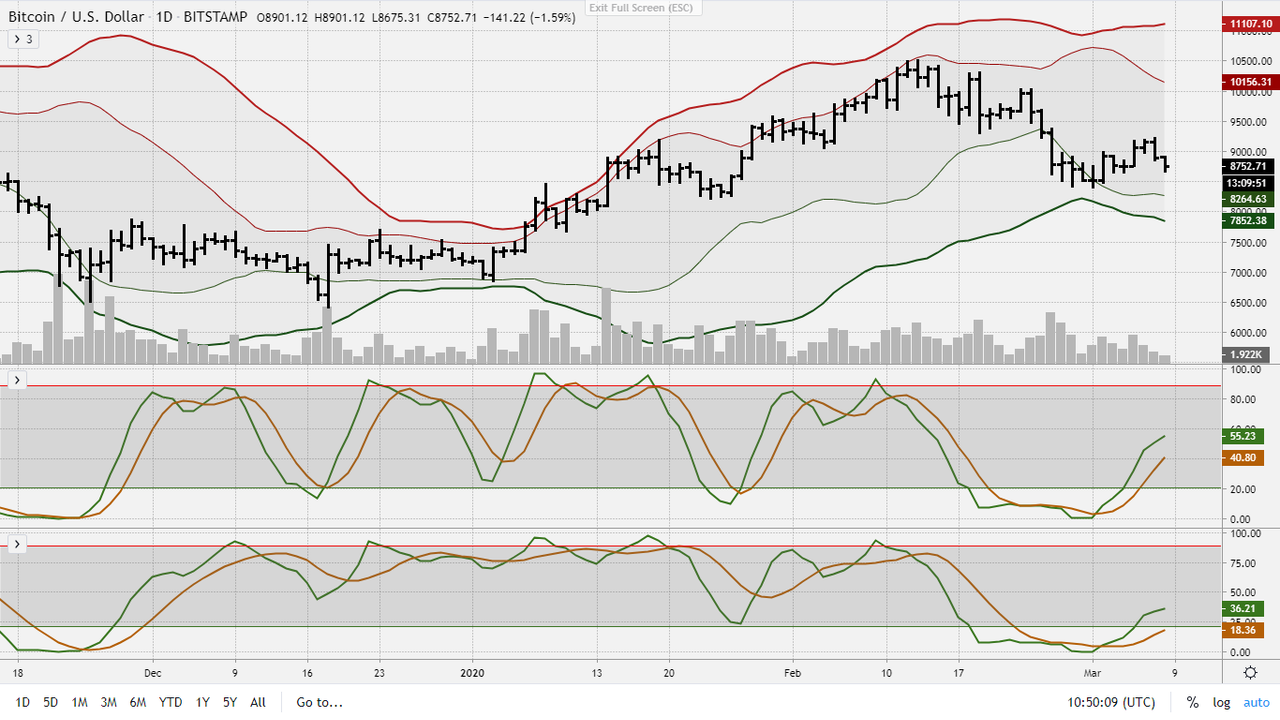
The daily stochastics, which were very oversold last week, have retraced as expected, creating some downside potential; with, most likely, also some divergence for a new bottom.
In short, it all comes together nicely.

However, when I stare at the weekly stochastics, as kalmly as possible, I see a lot more downside potential. Actually, I can see prices dropping below $6k easily.
Better not to look at that chart very often.
Replies (0)
Conversation
No replies yet
Replies will appear here as people join the conversation.